Accessibility in Traditional Reporting
The traditional Reporting module has long served as a vital tool for businesses seeking to analyze data related to assignments, sales, and customer interactions. However, several accessibility issues have been identified over the years that affect its usability for various individuals across organizations.
Providing an accessible experience for all users was not a focal point during the development of the Reporting module. While Reporting provides powerful tools for gathering data about the application, business, users, and processes, it is severely lacking in supporting operability for various users with a wide range of ability.
Many issues have been filed over the years regarding these accessibility issues, including numerous unlabeled interactive elements, inaccessible drag & drop functionality for authoring, charts that are not accessible with keyboard nor screen reader, and poor usability with tables.
Accessibility advancements in Explore Data
In response to the limitations of the traditional Reporting module, Explore Data and Insights was developed with a focus on accessibility and enhanced user experience. This new functionality aims to provide the same, if not improved, business intelligence capabilities of Reporting while addressing previous shortcomings.
To briefly touch on its capabilities, Explore Data and Insights allow users to create, view, and customize table or chart Insights, tailoring them to meet specific business needs. Users can filter, sort, and group data in an Insight to focus on the most pertinent information they need. Any Insight can be displayed in landing pages, scheduled to run at specific times, and shared between users in the business.
Similarly to Reports built in section-based UI Reporting, Insights can take the form of either a Table-based or Chart-based Insight.
Table-based Insights
Table-based Insights in Explore Data make use of the Table component used throughout the Constellation architecture. These tables are semantically coded as grids, which allow for a mix of read only and interactive data.
When navigating with a keyboard and/or screen reader, users can bring focus into the grid with the Tab key and subsequently navigate to any cell in the grid using the directional arrow keys. These grids are offer better usability and navigation experience for screen readers and keyboard users relative to the inconsistent navigation of Report tables, which often does not provide sufficient context for assistive technologies and keyboard users to make sense of the data and how it relates between columns.
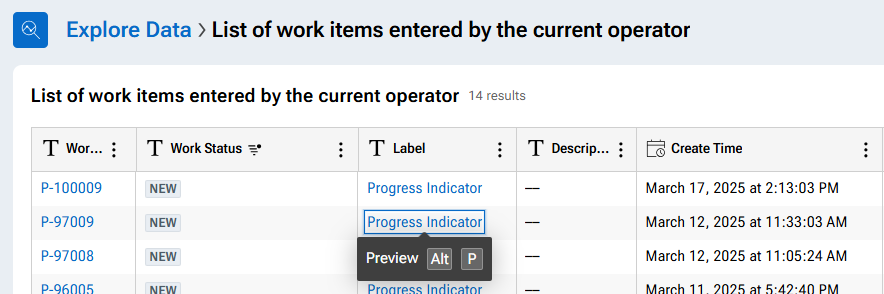
Chart-Based Insights
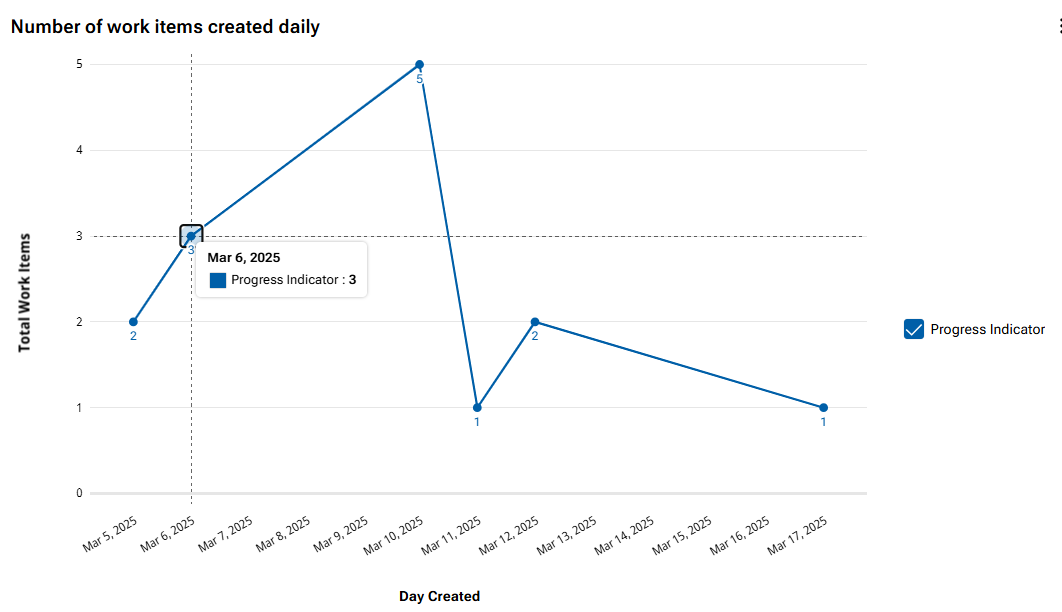
A significant advancement in Explore Data is the accessibility of chart-based Insights. With the release of Pega Platform '24.1, chart-based Insights support keyboard navigation, allowing keyboard and screen reader users to interact and understand the data where they previously could not interact with such charts at all in Reporting.
A user who wants to interact with the chart can first move keyboard focus to a chart on the page using the Tab key. Pressing the Enter key brings focus inside of the chart and to the data points. From here, using the Home, End, and Arrow keys lets users to navigate between chart columns and segments to get an understanding of the data at a more granular level. Screen reader users will also hear the relevant chart data announced as they navigate.
Legend values that can be enabled or disabled to distinguish data shown in the chart are also navigable with the keyboard, providing their name and role to assistive technologies as well.
Accessible Authoring
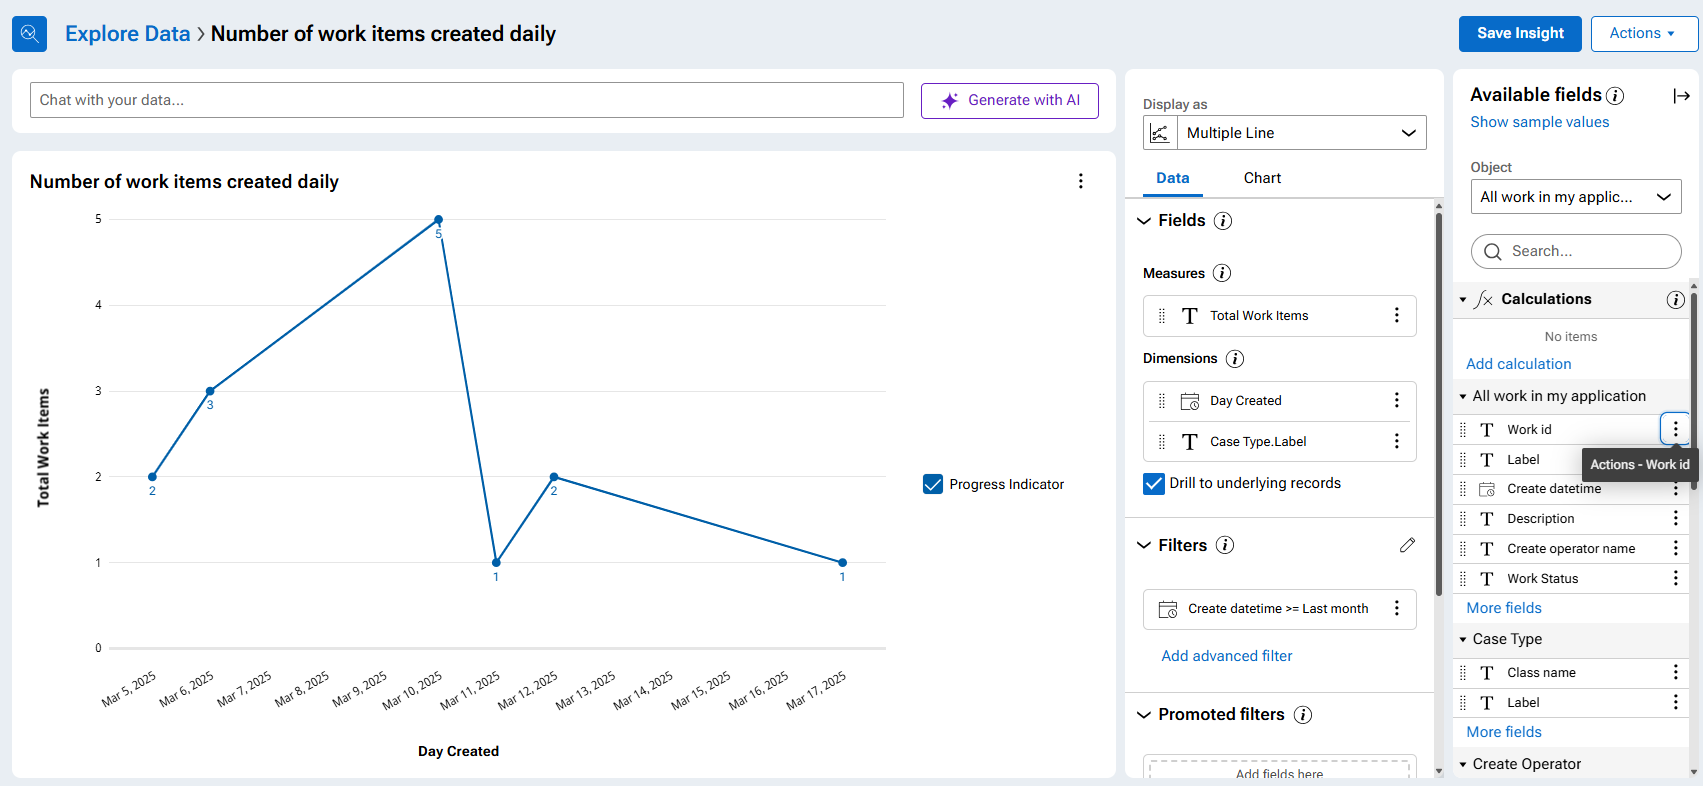
Starting in Pega Platform version ‘23, Explore Data introduces the ability for keyboard-only users to author Insights - a capability previously not possible due to the mouse-based drag-and-drop authoring experience in the traditional Reporting module. While mouse users can still make use of the drag-and-drop functionality, the Insight editor now provides equivalent experience for keyboard in adding or removing fields to the Insight, adding filters, groups, and sorts, and specifying the type of Insight.
Each section of the authoring panel is grouped into distinct section identified through semantic and hierarchically ordered headings, allowing screen reader users the added benefit of efficient navigation using shortcut keys. Each interactive element has a programmatic label reflecting its functionality and association to a specific field. For example, if a keyboard user wants to add the field “Work ID” as a measure to their Insight, they can do so by activating that field’s respective actions menu and add it to the desired location in the Insight. For interactive elements such as icons that do not display a permanently visible label, a tooltip with the programmatic label appears visible when a user brings focus to that element.
Accessing Explore Data and the path forward
Explore Data and Insights can be accessed through the Explore Data landing page, available in both Constellation and Theme Cosmos environments. Explore Data can be enabled for UI Kit applications by following the steps outlined in the documentation page for setting up Explore Data in UIKit applications.
While the traditional Reporting module will continue to be supported, it is no longer receiving feature enhancements and improvements as development focus shifts to Explore Data. Explore Data will continuously receive updates and enhancements to provide better capabilities to users while maintaining a cohesive user experience for all users with a diverse range of ability.