Discussion
Pegasystems Inc.
GB
Last activity: 5 Nov 2025 4:57 EST
Some insights into Insights (and Explore Data)
Why
Explore Data and Insights is a powerful Constellation feature. If I am being honest, one of my favourite Constellation features, unlocking value for Business Users who can create rich Insights and Dashboards in a very intuitive UX.
It introduces are new rule type and configurations for the Pega community, and as such I often get questions on this capability. In this post, I'll cover more comprehensive details to help advance your knowledge of this feature further.
Prerequisites
Documentation and training can be found on our documentation and academy. It is assumed the reader already has this level of knowledge and looking to advance further.
- Pega Documentation: https://docs.pega.com/bundle/platform/page/platform/reporting/reporting…
- Including troubleshooting: https://docs.pega.com/bundle/platform/page/platform/reporting/addressin…
- Including the ability to use Explore Data in UI Kit apps: https://docs.pega.com/bundle/platform/page/platform/reporting/enabling-…
- Pega Academy: https://academy.pega.com/module/exploring-application-data-insights/v5
- Including the challenge: https://academy.pega.com/challenge/creating-insight/v8
Understanding Insights further
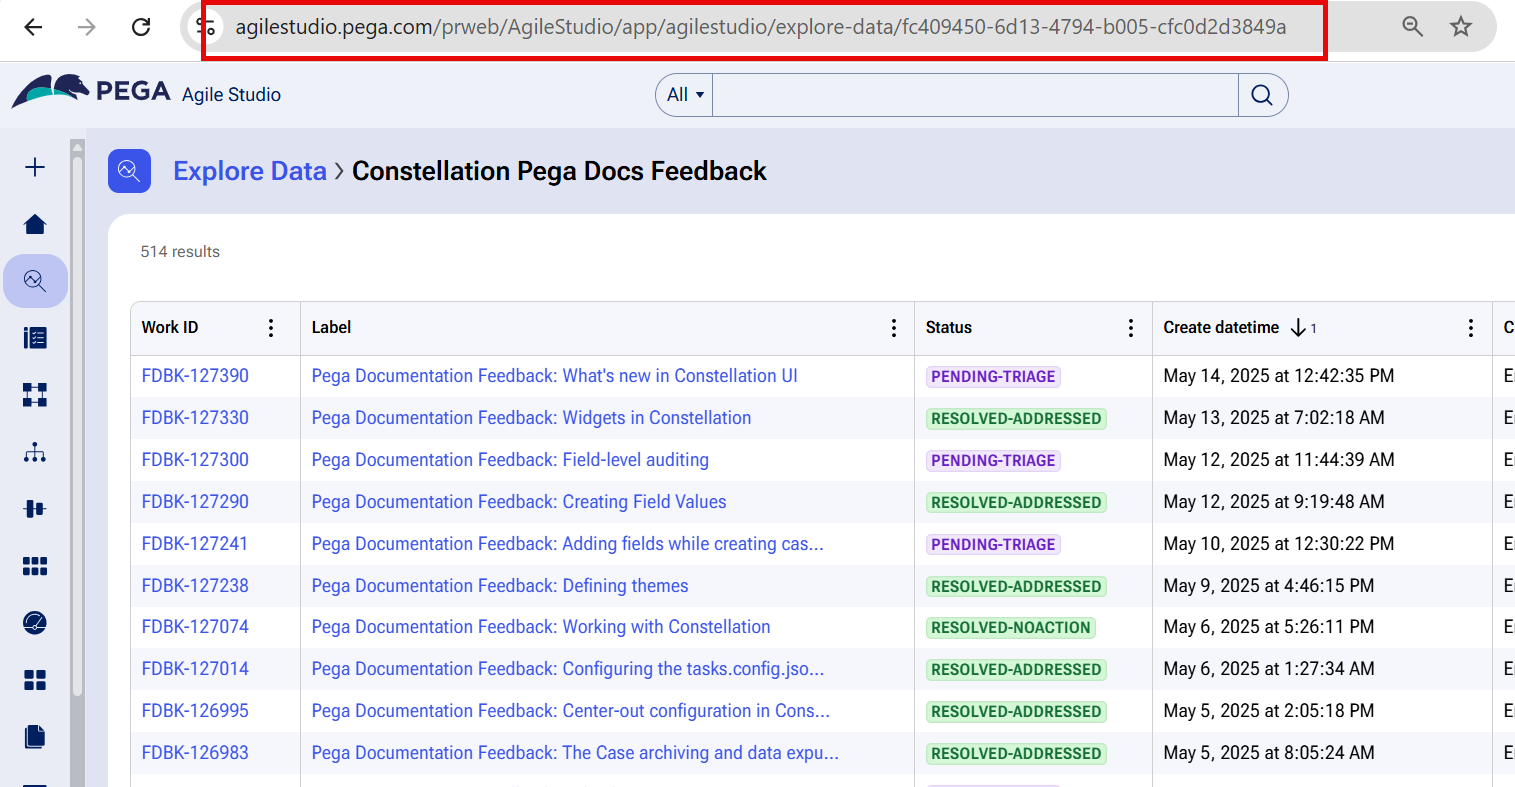
URLs for Insights
I love the fact Constellation allow you to open links direct to cases or landing pages. This is a great Out of the Box feature for our Single Page Application architecture, it was always an overhead to implement in UI Kit Apps.
Something that is little known, you can copy the URL's for Insights as well.
- Using an Insight in a Case, Landing Page or Dashboards is the preferred consumption method but it does open up use cases where these might not apply. E.g. Please email a daily "start my day" email with a the list of hotel reservations for today and a link to the live information.
Open the Object in a Table or Drill to underlying records
When creating Insights, as table, OR a graph that drills through to the data (table), its a common request that we can configure which column opens the Case or Data Object in the Insight.
In 24.2, this is current not possible to configure the column to open, nor the fields that show in drilling to underlying records. There is enhancements to add this in future releases.
- However, this can be configured if you use a List View - see the "Using Class Joins" section later on with an example.
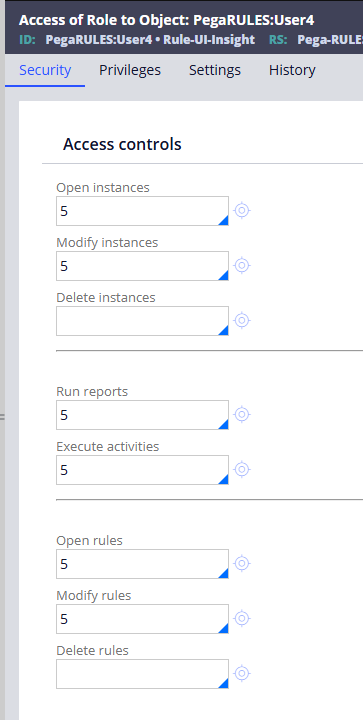
Security
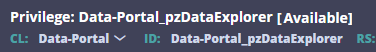
Explore Data
The privilege for Explore Data landing page is Data-Portal_pzDataExplorer. Access to this should be handled Out of the Box if you use App Studio to create and manage the basic RBAC for your Persona. However, I have seen instances where apps that predate this feature, have not had this added to users when they start using this feature.
- Resolves issue: The Explore data page is not visible for a user, despite the landing page being added to their portal.
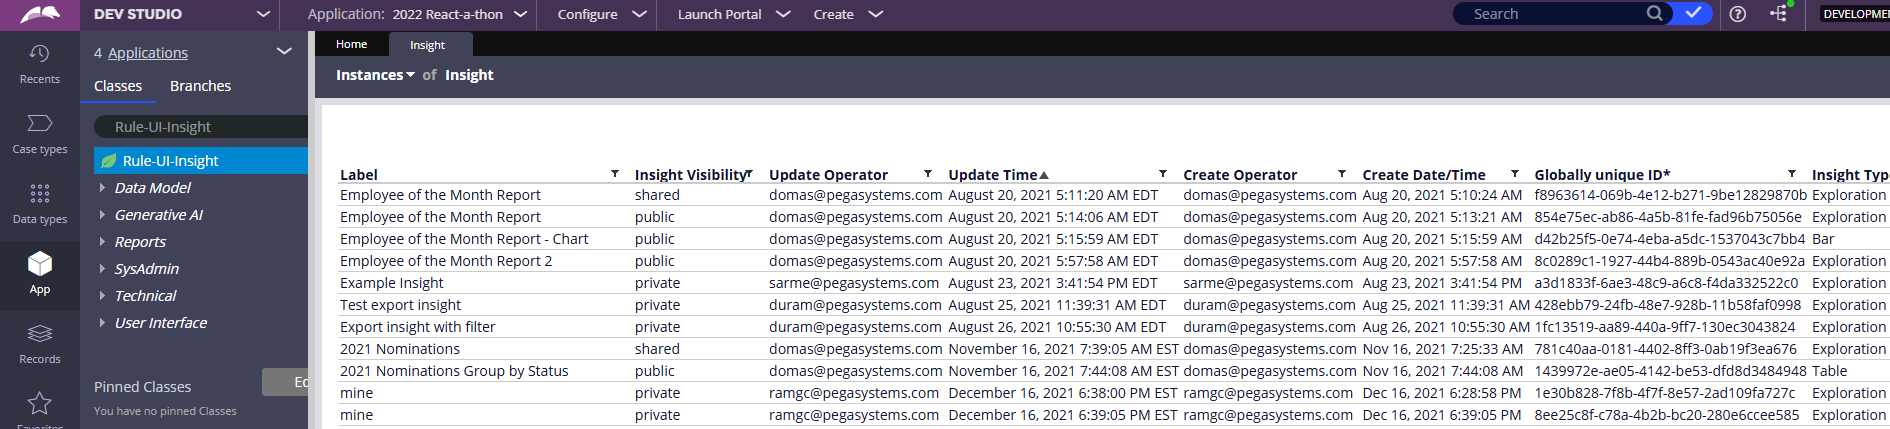
Class
Insights are saved to Rule-UI-Insight. Like above, access should be handled in new applications. However, older Access Groups might not have access to create rules into this class
- Resolves issue: this can block that user from saving new Insights. User gets a "Insights failed to save. Check console for more details".
[Update/Clarification]
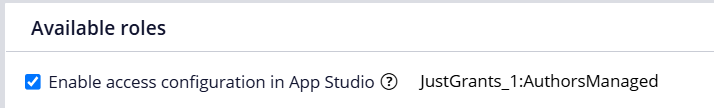
When I say Pega OOTB handles this in newer applications, I'm referring to Persona creation (from App Studio). This creates your Persona, mapped to an Access Group, that inherits from the right roles and is managed in App Studio.
If you go it alone in Dev Studio, creating an Access Group from the ground up (not recommended), you may not have this setup correctly to both work in App Studio and inherit the right roles/privileges.
Rules & Production Rulesets
Creating an Insight Rule
When you create an Insight via Explore Data, you are creating rules to Rule-UI-Insight.
Application Authors (Developers)
If Application Authors are trying to do this, this means it will be saved to a Workspace, Branch or Open Ruleset, just like any other rule using the same "next best ruleset" algorithm.
Business Users
If business users are trying to do this in Production, this means you need a Production Ruleset. So the general configuration of a Production Ruleset applies.
- Create a Production Ruleset
- Add it to your application
- Ensure the business user's Access Group has explicit access to the Production Ruleset
- Ensure the Operator Record has "Allow rule check out" so they can save the Insights.
- Resolves issue: this can block that user from saving new Insights. User gets a "Insights failed to save. Check console for more details".
Hiding or Removing the Out of the Box provided Insights
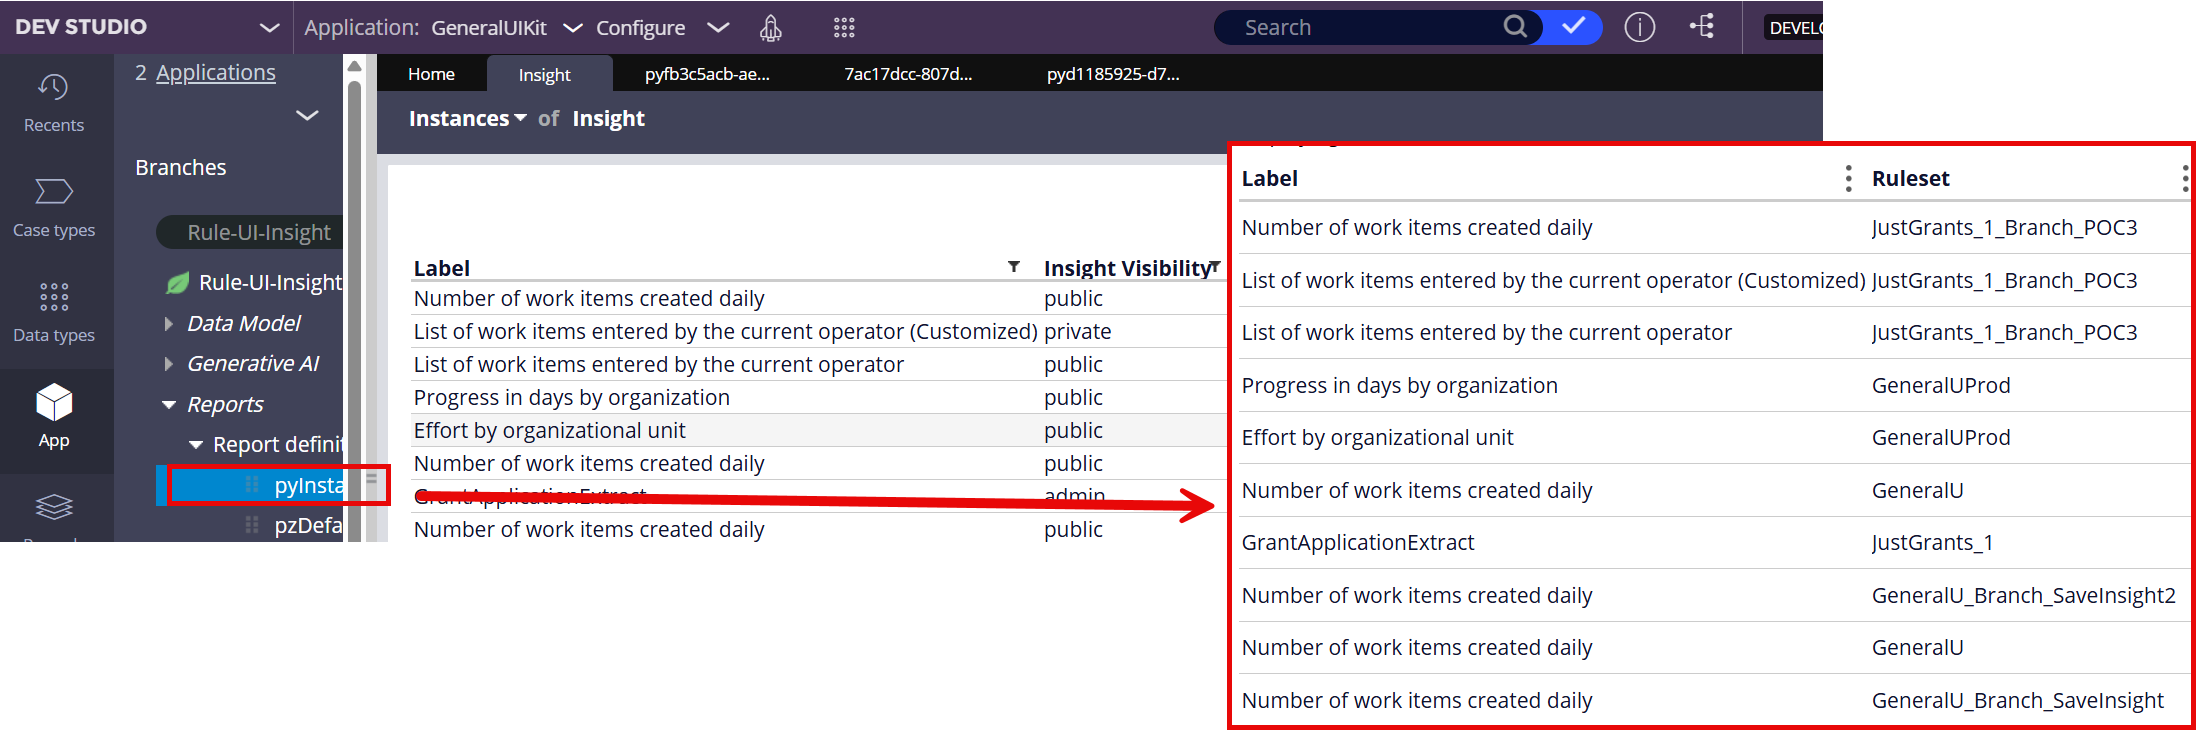
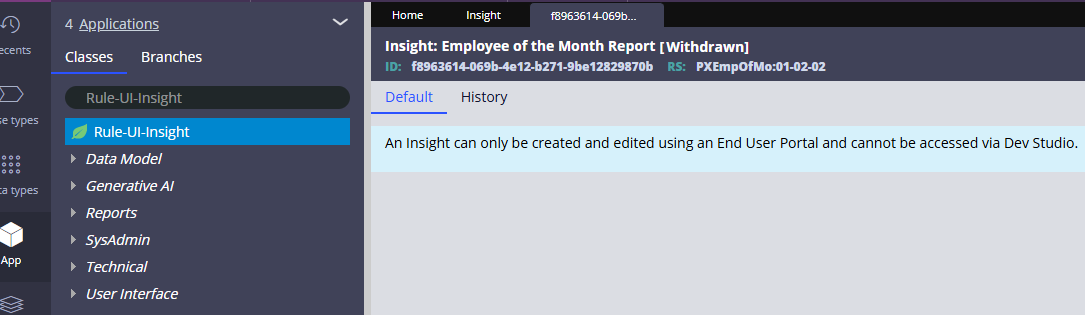
As an Insight is a rule, you can withdraw the provide insights if they aren't required for your application.
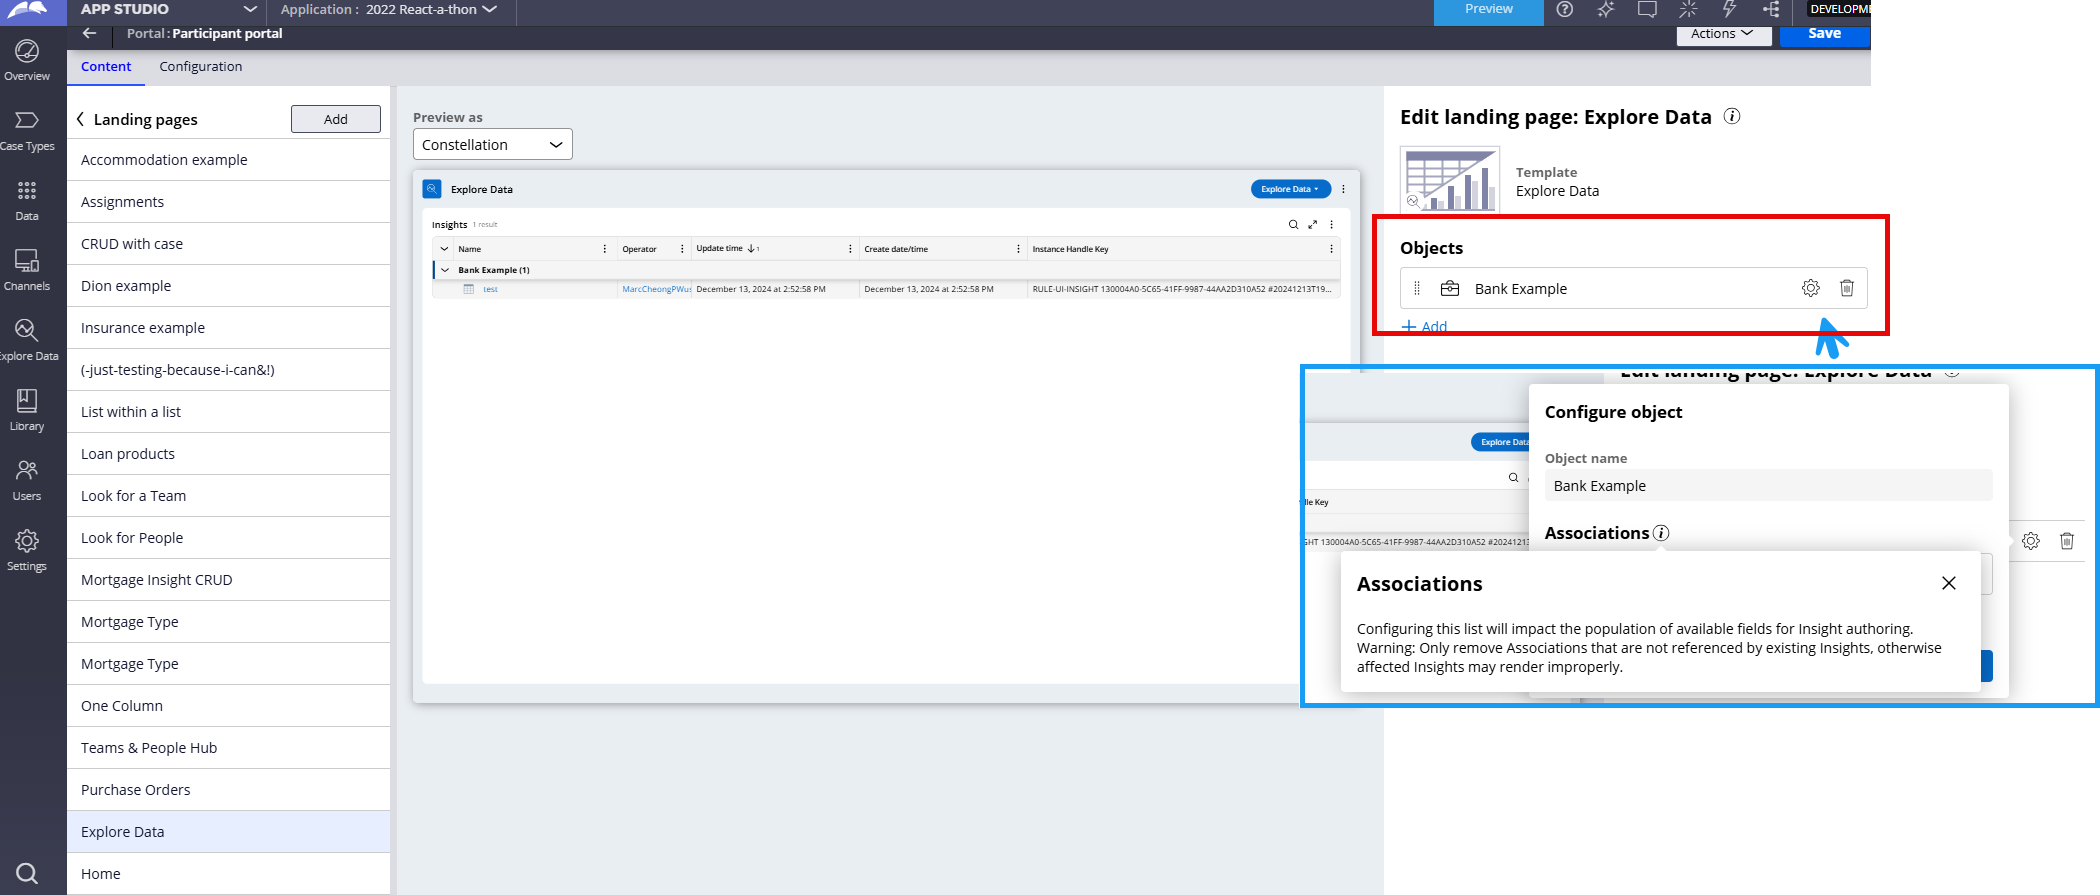
Additional Configurations on Explore Data Landing Page
In App and Dev Studio, you are able to configure the Explore Data Landing Page, this includes which objects are viewable and Associations included.
- Resolves issue: Objects missing from Explore Data OR Insights have additional rows (additional data access via an Association)
- In addition to troubleshooting steps here https://docs.pega.com/bundle/platform/page/platform/reporting/missing-d…
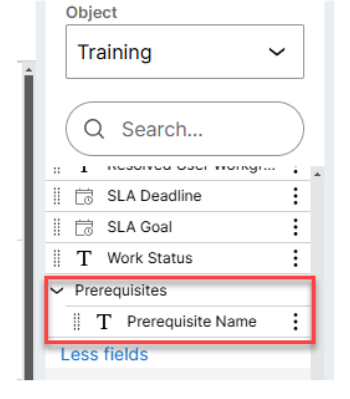
Insights on Lists (e.g. Embedded Data)
In 24.2, Insights supports multiple levels of Embedded Data.
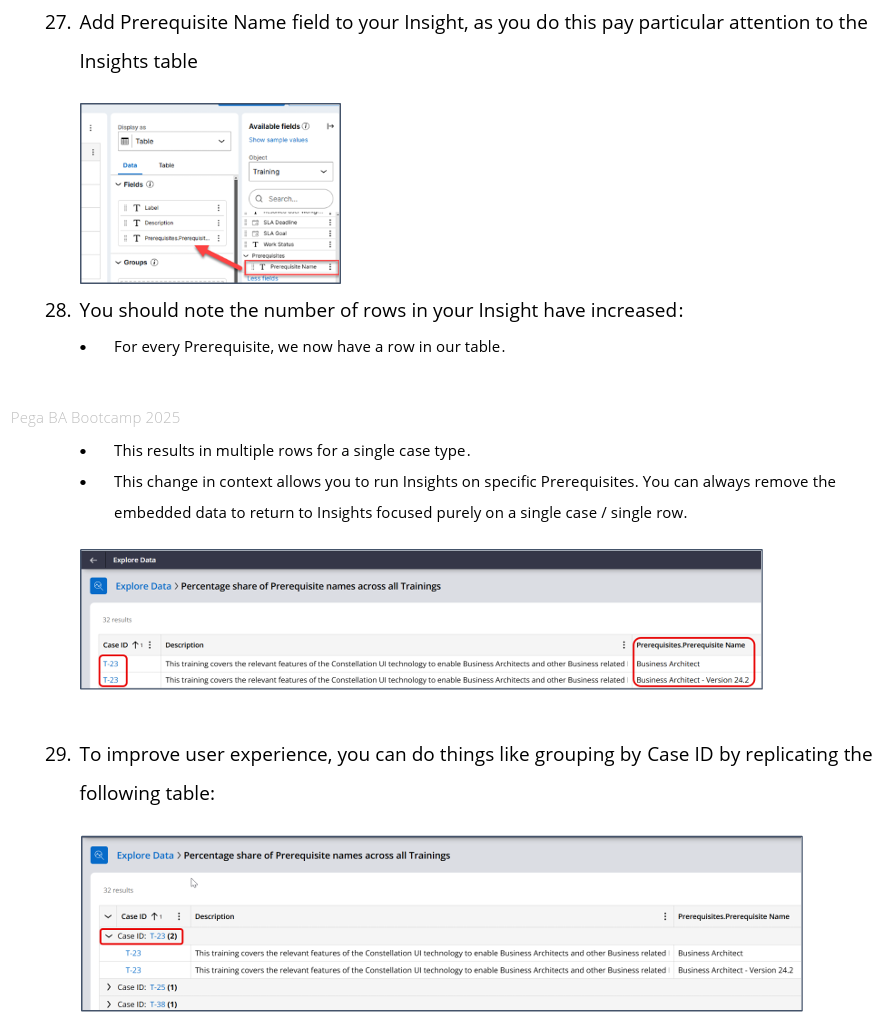
Say for example I have a Training Course and there is a list of training you must have done before attending (Prerequisites), then you can run insights on these Prerequisites.
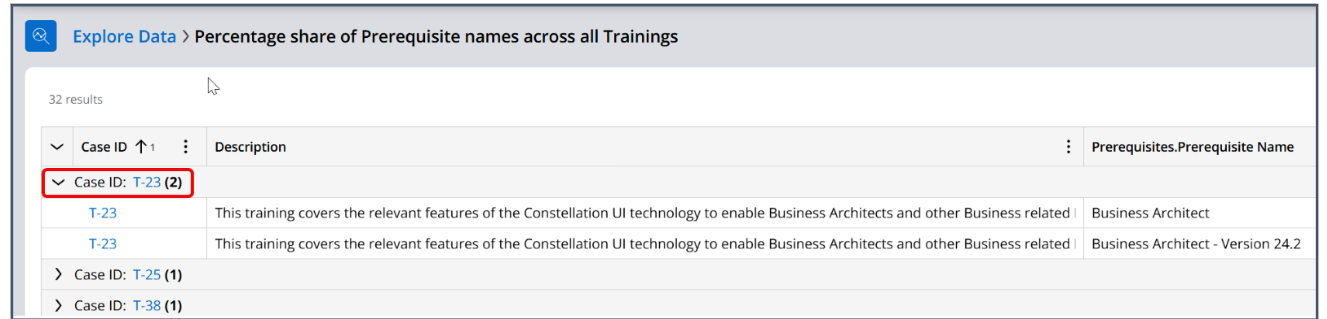
Similar to Report Definitions, when you add additional data via say a Join, this will create one row for each of the listed items.
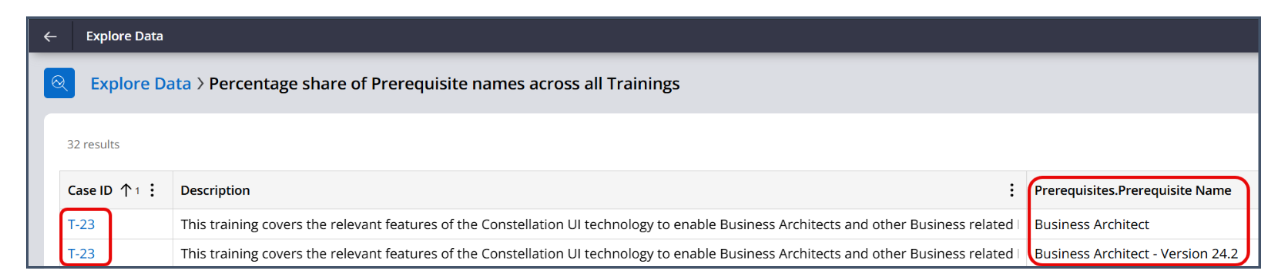
To improve user experience, you can do things like grouping by Case ID by replicating the following table. A great feature of Constellation tables:
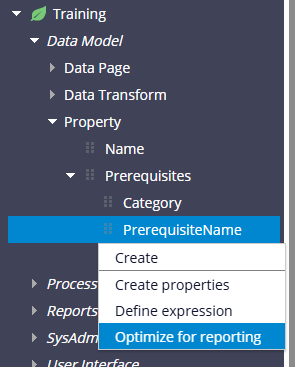
Optimize Property
To enable all of the above you must optimize this embedded field for reporting, to unlock this.
Insights on References (e.g. Data Reference, User Reference etc.)
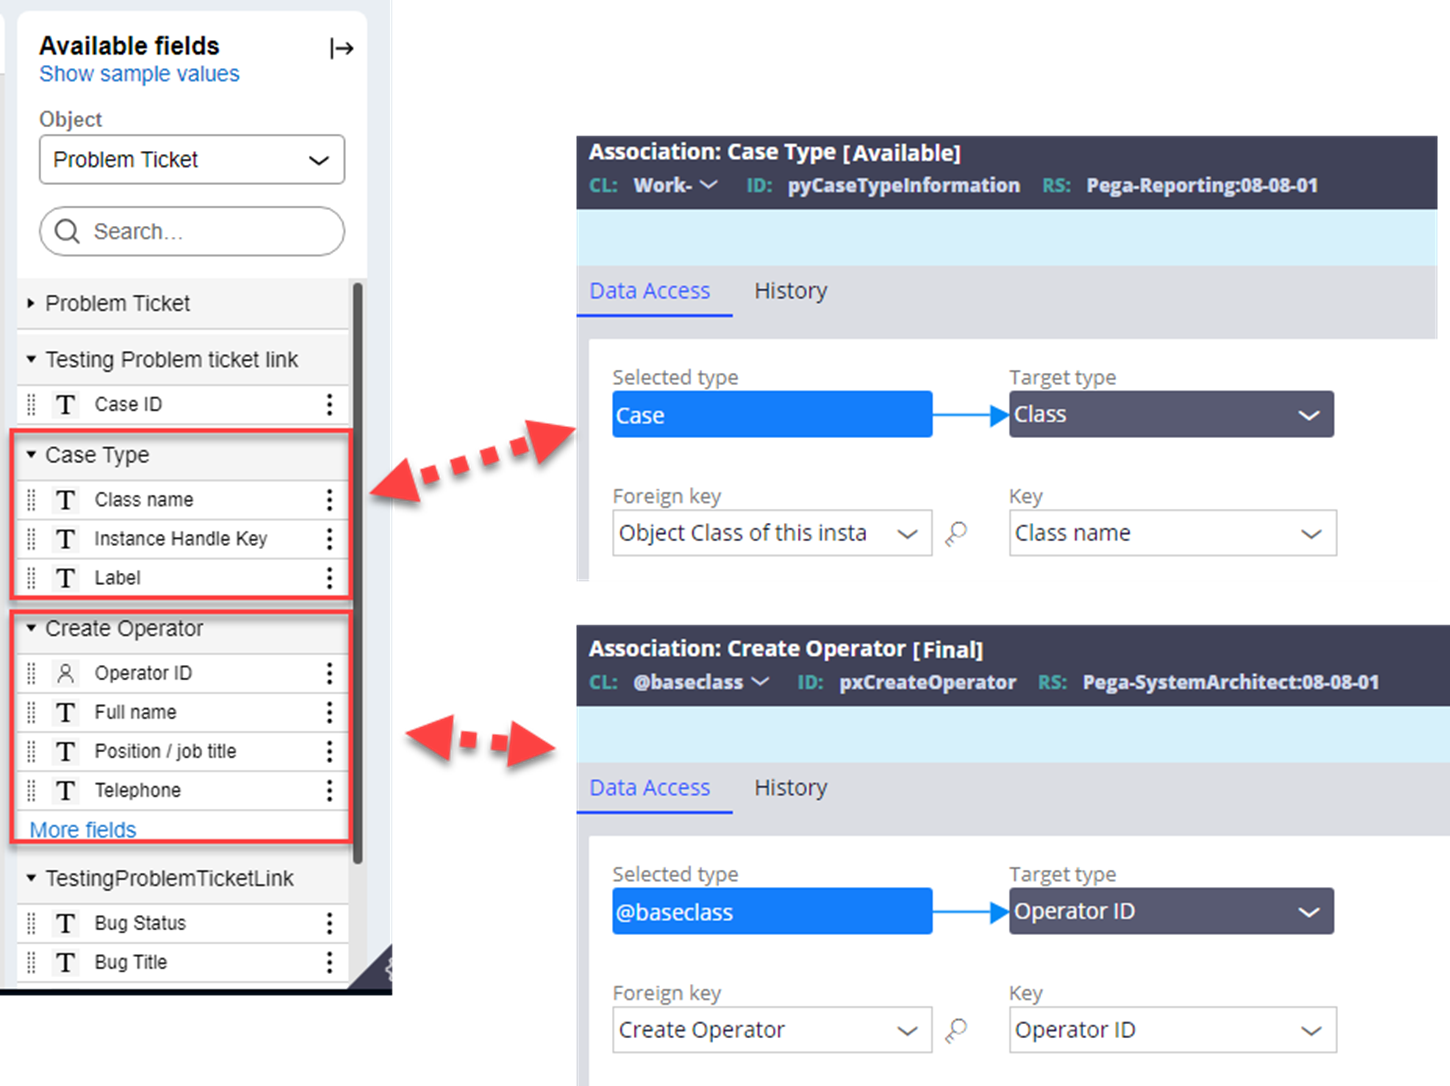
In Insights, the Association Rule, provides a simple way to access additional data to be used in your Insight. When you start creating an Insight, you will see some of the Out of the Box associations provided.
Using Class Joins
You an not use Class Joins in Insights.
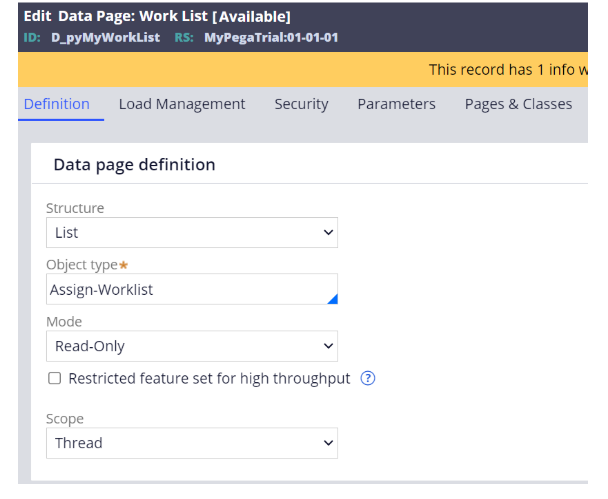
However, you can use these in a DataPage that can then be used to source a List View.
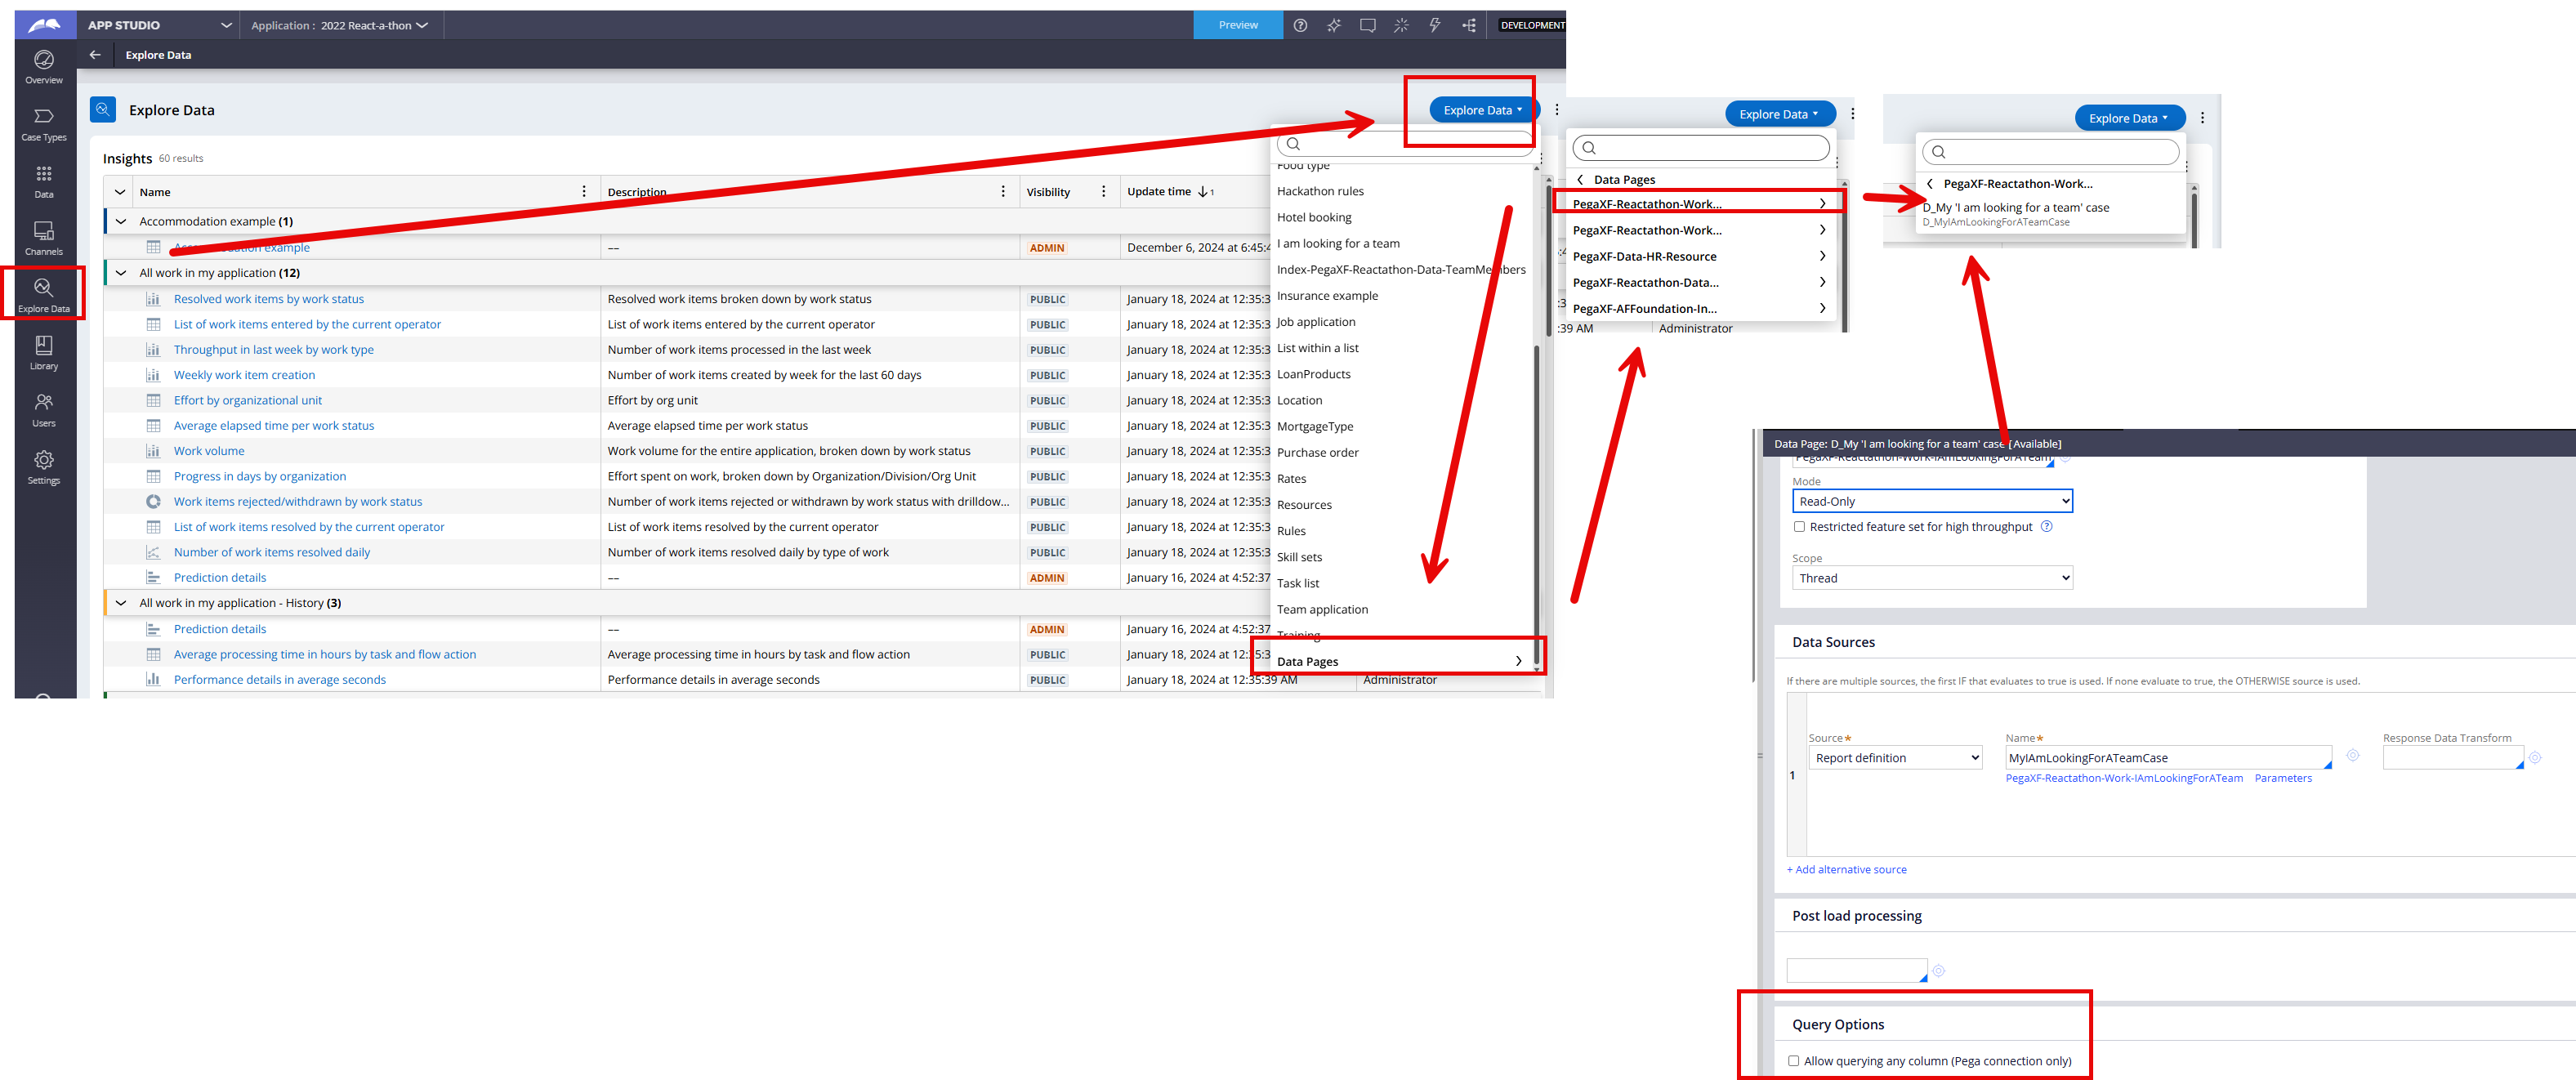
- Example: Home page shows the default worklist view with details from assign- class. We want to show some of the properties from work class in this view. How do we approach this requirement?
Steps:
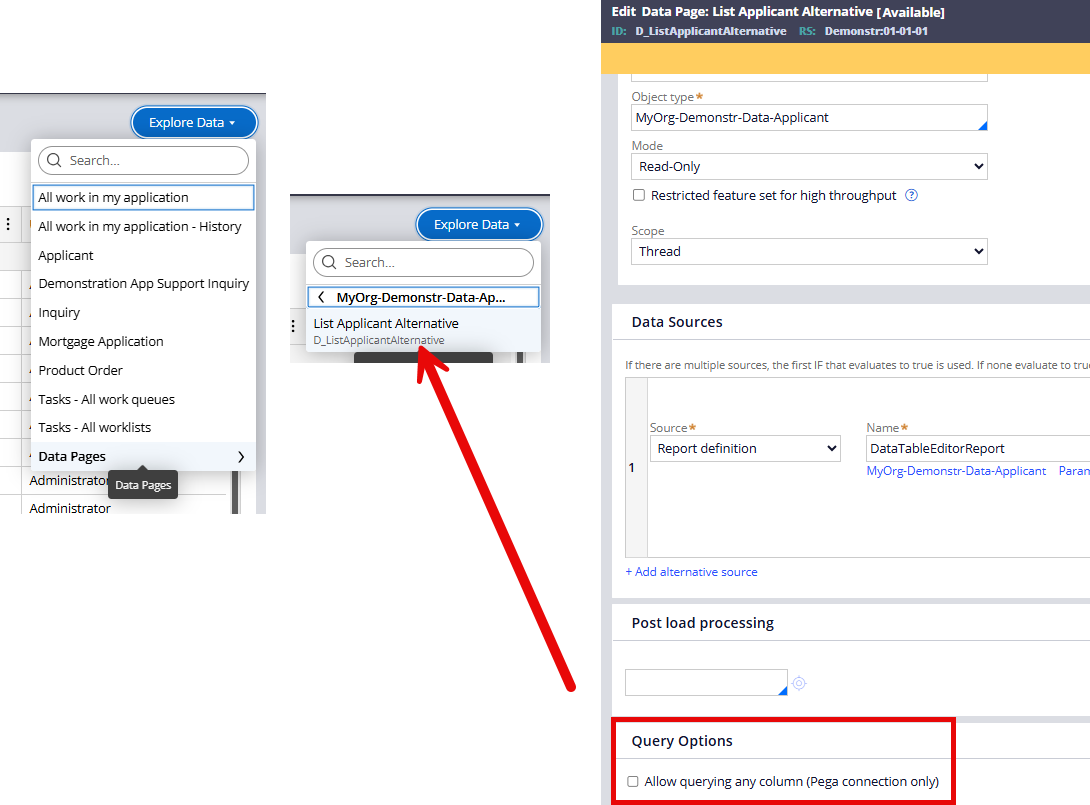
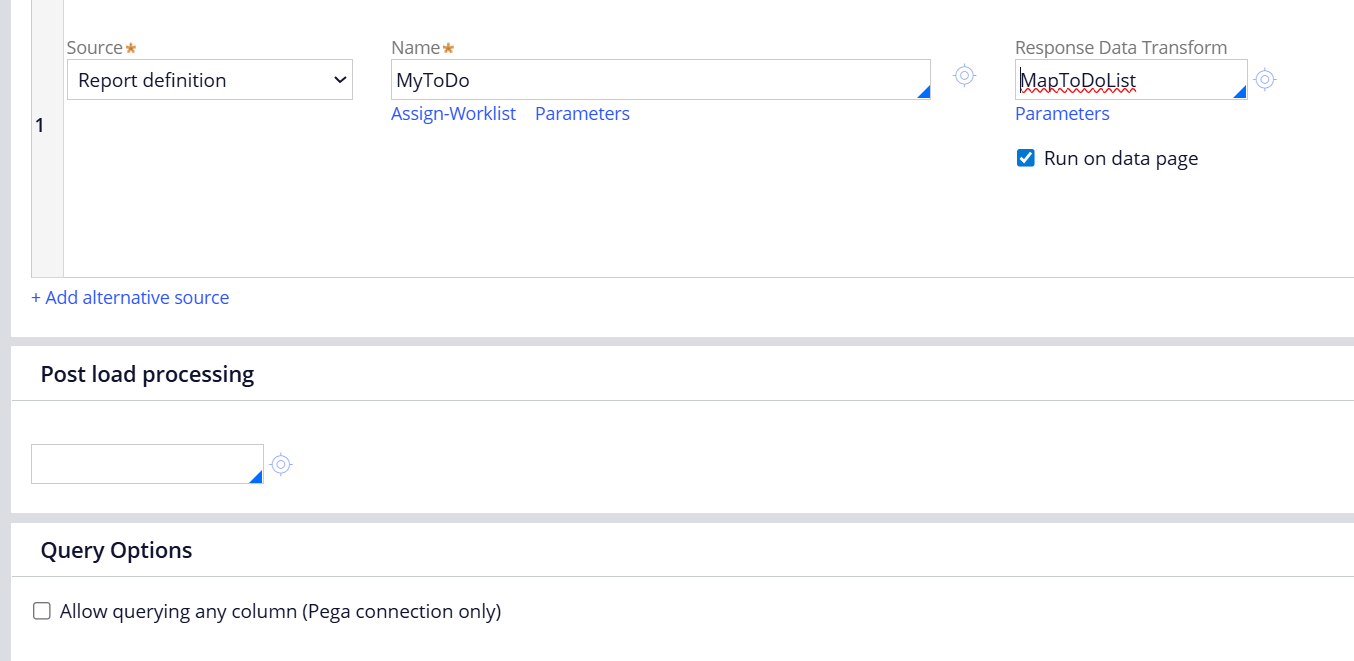
- We can save as the existing Data Page and existing RD to make the changes.
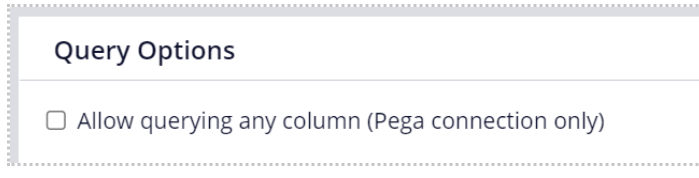
- Ensure Data Page has "Allow querying any column" unchecked
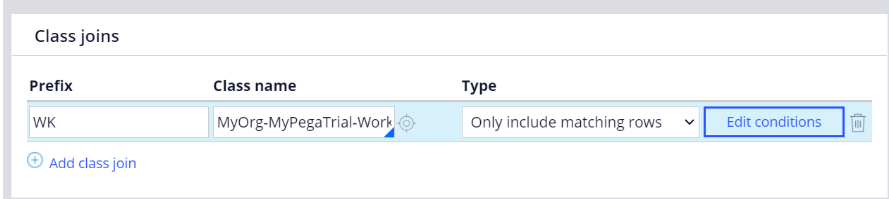
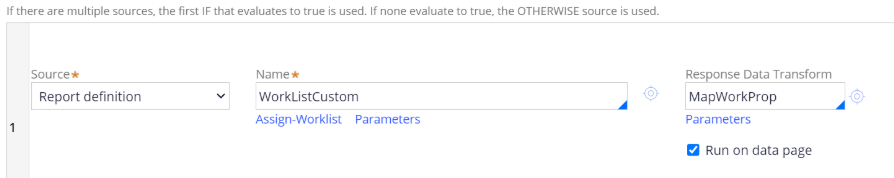
- Add join with work class and add the work class columns to the RD.
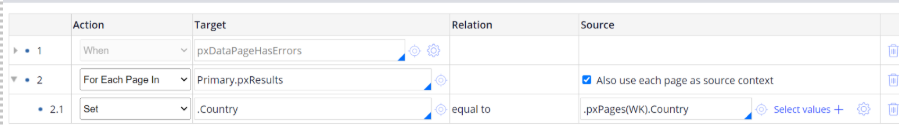
- In Constellation we cannot access properties from pxPages (Join class) directly. Instead, we need to flatten the DP using a response DT.
- The dummy property created in Assign- class for each property fetched from work class has to be marked relevant.
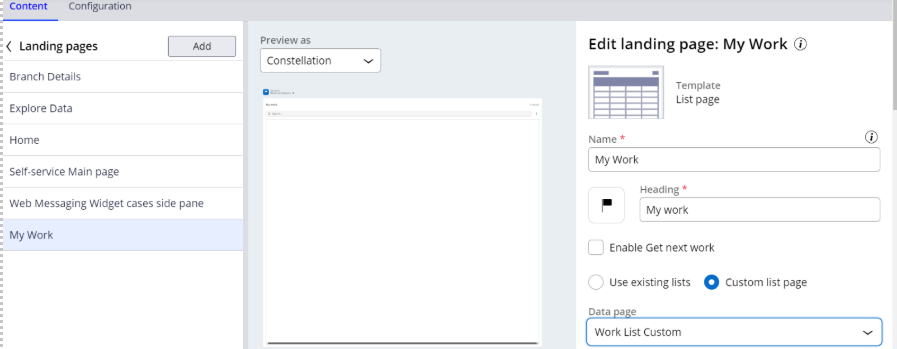
- Now use this data page for the “MyWork” landing page for your portal.
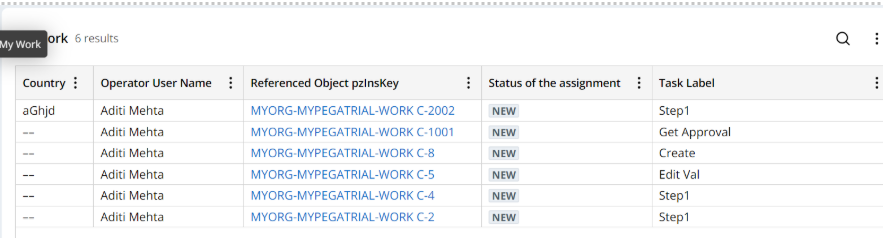
- The updated “MyWork” landing page will look like this.
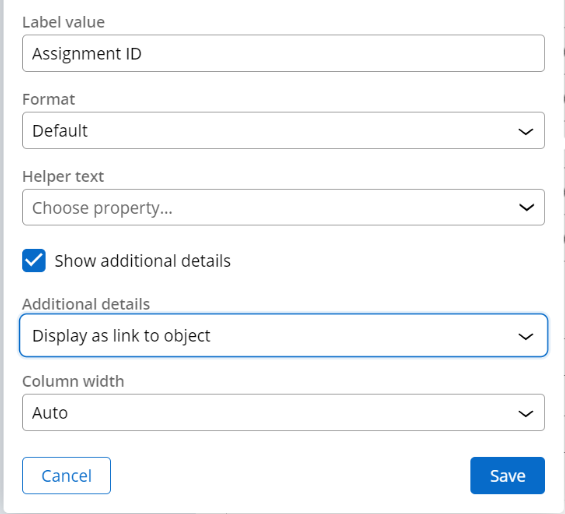
- Note: To enable the link to the key, you need to alter the field as shown below:
Tables: Insights vs List Views
As implied in a few of the topics above, the configuration and display of an Insight as a Table vs a List View as a Table are different. If you can not achieve your use case with one, you may want to look at the other.
Key differences for me are:
- Controlling the column you want to open the object (List View)
- Using any Data Page you like to source the list (List View)
- Insights allow adding more columns than what is seen, including sorting/filtering
- Insights could save row density, merges and freezes for large information
- List View tables only allow you to sort/filter from columns that are visible and they can allow you to build filters for user to use (permittable filters)
- Search bars are different
Share your experience
Got some other tips? Feel free to share in the comments below.
Even more Insights into Insights (and Explore Data)
Some great resources you may want to explore:
- https://support.pega.com/discussion/clsa-community-meetup-gain-insight-…
- https://support.pega.com/discussion/ask-expert-reporting-explore-data-a…
- https://community.pega.com/conversations/user-experience/advanced-searc…
Constellation 101 Series
Enjoyed this article? See more similar articles in Constellation 101 series.
Updated: 16 May 2025 17:45 EDT
Capgemini
IN
@MarcCheong - Thanks for sharing the tips and tricks. Quite helpful.
While implementing insights (in Pega Infinity 23) we came across a scenario where I would like to get your views on:
1. We have an insight that shows a pie chart to count the number of work objects (e.g. in "Open" status it shows 20).
2. When we drill down to each region in the pie chart, the detailed view shows the work objects corresponding to the selected status "Open" - so drill down view should show record count as 20.
However, in the drill down view RD, we have an association with a data class to show the number of Products for each work object. So, if each of the work object has 2 products, in the drill down view there are altogether 40 records and the count is displayed as 40, which is misleading for the user.
Can you please suggest how to overcome this?
Updated: 18 May 2025 8:05 EDT
Pegasystems Inc.
GB
@Sudit Sengupta I would need some more details on your scenario. Step 1 and 2 I can follow, this is just Explore Data and Insight is a chart. When you click a section of that chart, you have "drill to underlying records" enabled and then it shows the list.
So at this point, I am assuming it looks like the the below, both with the drill to underlying in configuration, then the click and open records modal (though this is 25.1 so it won't be 100% the same)
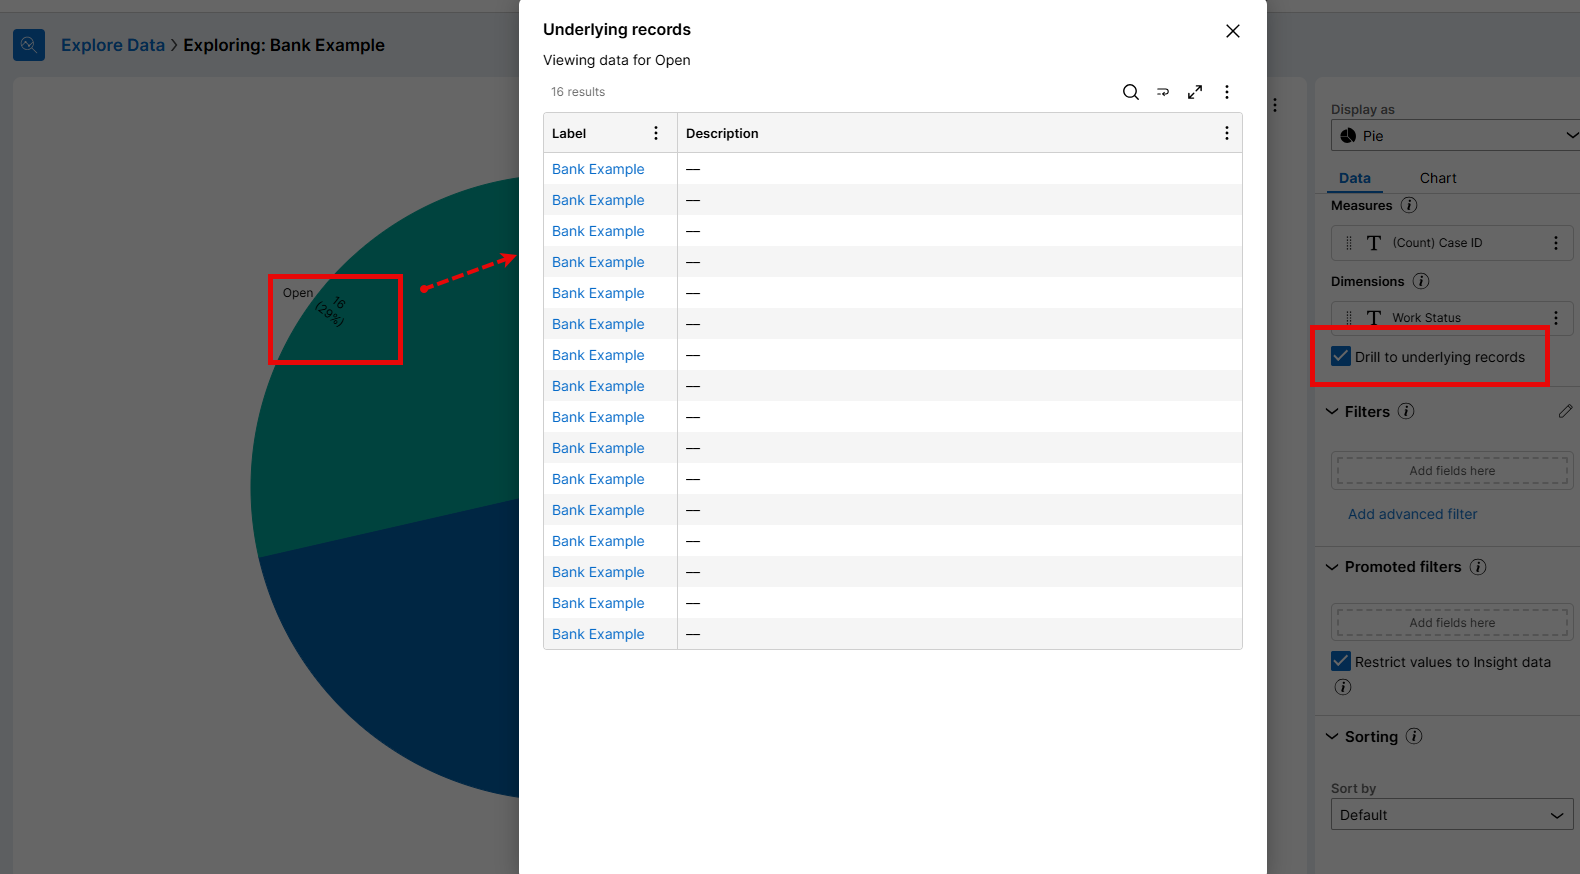
Where I am lost is your description the underlying report definition, Insights doesn't source from a report definition that you can edit like the Traditional UI "Report Browser" capability. So I might have missed your configuration - if you associate data in the chart, then its also associated in the drill. Would need a little more background on your configuration.
Solution?
However, that said, Associated/Joined/Embedded Data, is an inherently confusing topic for business users. When you expect 20 cases, and see 40 lines (due to the joined data), it can confuse business users.
In this scenario, I would be looking at making it more accessible.
@Sudit Sengupta I would need some more details on your scenario. Step 1 and 2 I can follow, this is just Explore Data and Insight is a chart. When you click a section of that chart, you have "drill to underlying records" enabled and then it shows the list.
So at this point, I am assuming it looks like the the below, both with the drill to underlying in configuration, then the click and open records modal (though this is 25.1 so it won't be 100% the same)
Where I am lost is your description the underlying report definition, Insights doesn't source from a report definition that you can edit like the Traditional UI "Report Browser" capability. So I might have missed your configuration - if you associate data in the chart, then its also associated in the drill. Would need a little more background on your configuration.
Solution?
However, that said, Associated/Joined/Embedded Data, is an inherently confusing topic for business users. When you expect 20 cases, and see 40 lines (due to the joined data), it can confuse business users.
In this scenario, I would be looking at making it more accessible.
1. Could you create a landing page with the Insight Chart on the top and then a List View or Insight Table below, with the joined data. I would then group this data by the work object, so its clear that each work object has 2 different products.
- Here's an extract from a bootcamp training mission I put together recently. We have a Training Course, that can have multiple Prerequisites (pagelist) and we want an insight on these. Grouping helps visualise the embedded data (pagelist) that has increased the number of records.
2. Could you flatten the data? Create a concatenated field with all the products list. Then its no longer a pagelist and just a text field, then you could show this in a flattened table, there would be 20 records and no confusion on end user part. This isn't the greatest from a data modelling perspective, however, I have seen this approach used successfully to simplify data for consumers of List Views or Insights.
Updated: 28 May 2025 11:00 EDT
Capgemini
IN
@MarcCheong- Thanks for your response.
Yes flattening the data to create a concatenated field is an option, but like you said its not ideal from a data modelling perspective and also has an additional maintenance overhead of managing the concatenated values when user adds or deletes items.
Regarding my point about the drill down RD, what I meant is the following:
1. Insight is configured on a particular data class. The data shown in the insight is based on a D page (API type) which is sourced from an RD.
2. On drill down, we need to have specific fields shown to the user. In such a case, the RD mentioned in point 1 needs to be changed (from Dev studio) to add additional fields (e.g. by using an association). This is where the rows will be duplicated for each embedded data (e.g. Products).
So, we have the following options:
1. Do not display embedded data (list type) in the drill down view of an Insight
2. flatten the data (e.g. use a field to show concatenated data)
3.Do not allow drill down in the chart based Insight. Create a chart Insight and then a separate table Insight down below (like you suggested)
Is this a correct understanding, or am I missing something?
Pegasystems Inc.
GB
@Sudit Sengupta ok, I understand. I wouldn't really recommend playing around with the underlying RD as it may have other consequences. I've seen the same for OOTB created datapages (single, list and saveable) for new cases/data too - its best to create new ones if you need something specific, Constellation features rely so much on these you don't know what else might be utilising it.
Further more, the Product is looking at giving more control over the drill to underlying records, such as what columns we show. So things are coming in this space.
Solutions
Your summary of solutions is accurate. Personally, I would explore option 3 with the business - this kind of complex data, and getting the business to understand it, probably needs more than just an Insight can convey. A dashboard or landing page, might give you some more options such as promoted filters and search capability to make it more understandable. Landing pages give you added benefits of putting other widgets on the screen, like "announcements" that could also provide more instructional guidance.
Capgemini
IN
@MarcCheong - Thanks for your response and Guidance. Good to know that in the future we will have the ability to control the drill down view to present the columns that are needed.
UNUM Group
US
Does the column filter (Insights or List View) work correctly for the properties set via Data transform ? I believe when we apply column filter its running against the report definition .
In above ex: if we apply column filter for Assign-"Country" not equal to "India" , then the values would still be set via Data Transform and it would show up in the table ?
Pegasystems Inc.
GB
@Adithya_AI'm not 100% sure it will. In fact, Insights run against a virtual report definition - unlike Traditional we don't have full control over how that populates (like a single report definition). If the data is not in the data object, then I would say it won't be there, but would have to test that scenario to be 100% - I am leaning on my experience with calculations (declare expressions) here, they don't populate for Insights.
If you want to be sure, I'd be designing to ensure whatever data object you are reporting on has the data you want OR you build an association to retrieve it.
- I posted recently on using advanced joins to do this on top of just a simple association to data https://support.pega.com/discussion/utilising-advanced-associations-joi…
In '25, they are planning to release the ability to run calculations directly from your insight - which may also give a different avenue if you don't want to add to your data model.
UNUM Group
US
@MarcCheong Is there any config available to hide "Save as" in Actions button ? like how "Edit" is hidden when not shared

Pegasystems Inc.
GB
@Adithya_A It's not an OOTB option, no. Curious on your use case here. If you give someone access to Explore Data, then they have the ability to create ANY insight they like (subject your access controls against certain objects).
So, even in the absence of "save as", I could replicate that Insight exactly. In fact, you're probably annoying the business user, as if they did have a scenario where they wanted modify their own version slightly, they would have to start from scratch.
For users who should not be playing around with creating their own insights, including save as, you could look to put this Insight on a Dashboard or Landing Page? This would mean they were just be a consumer of that Insight created and then no concerns with making changes.
UNUM Group
US
@MarcCheong Thanks for the info Marc , we actually want a view only Insights where users will be present list of reports/insights to click on , but they should not be able to create new or save as existing reports conditionally ex: Managers can create and save as Insights , but Users can only view
Is it possible to build a list view table in landing page and have a clickable link which opens the insight rule , similar to My Work with case id link ? need to check this
In Dashboards i see there is no single column template available .
Pegasystems Inc.
GB
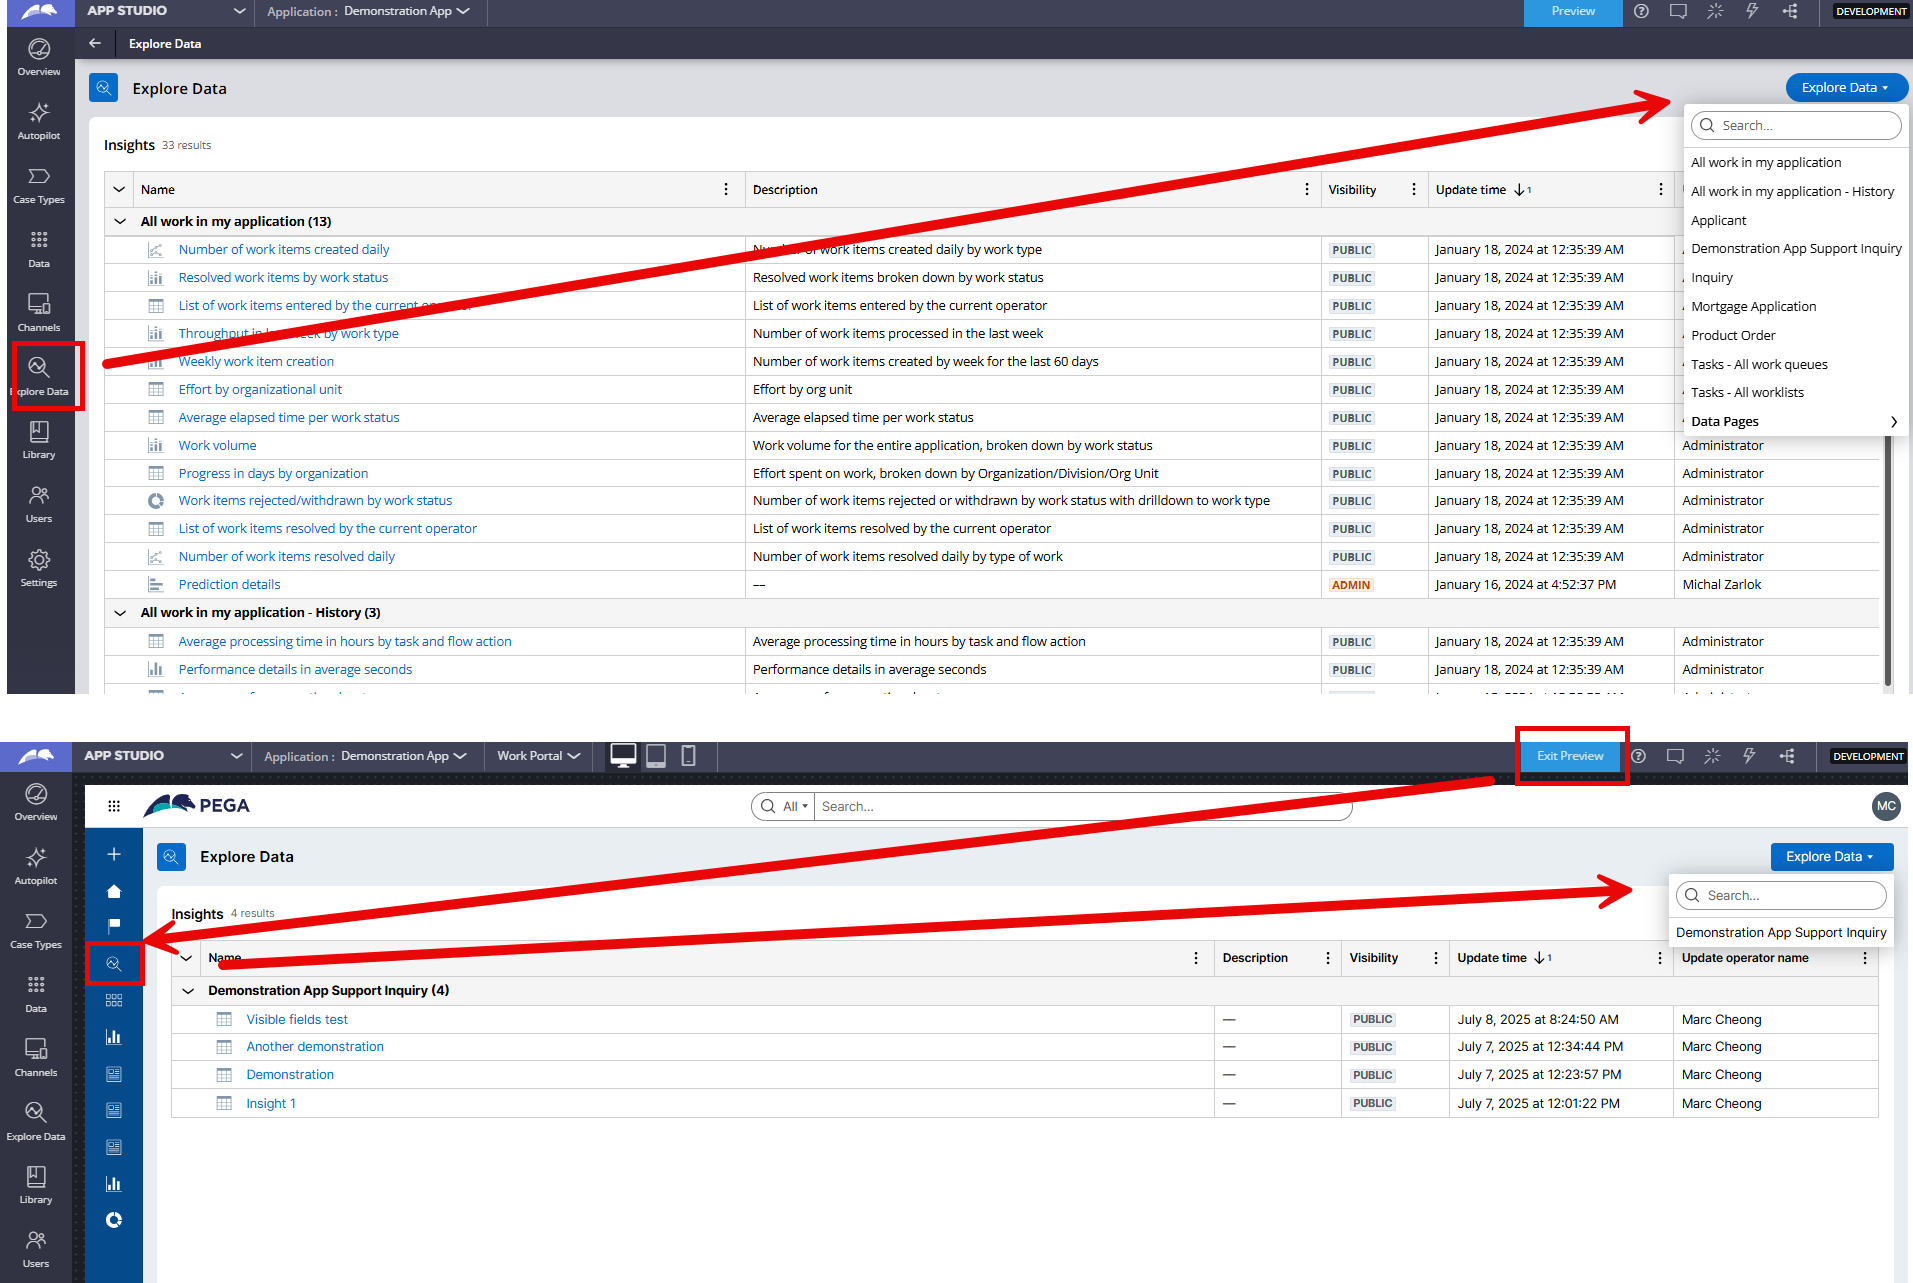
@Adithya_A would a Landing Page not work for you then? You can place an Insight on a landing page and there is no run time ability to save/edit it.
Image from a lab instance I have, not the greatest example but shows an insight on a landing page and the run time experience. Sounds like this is what you want?
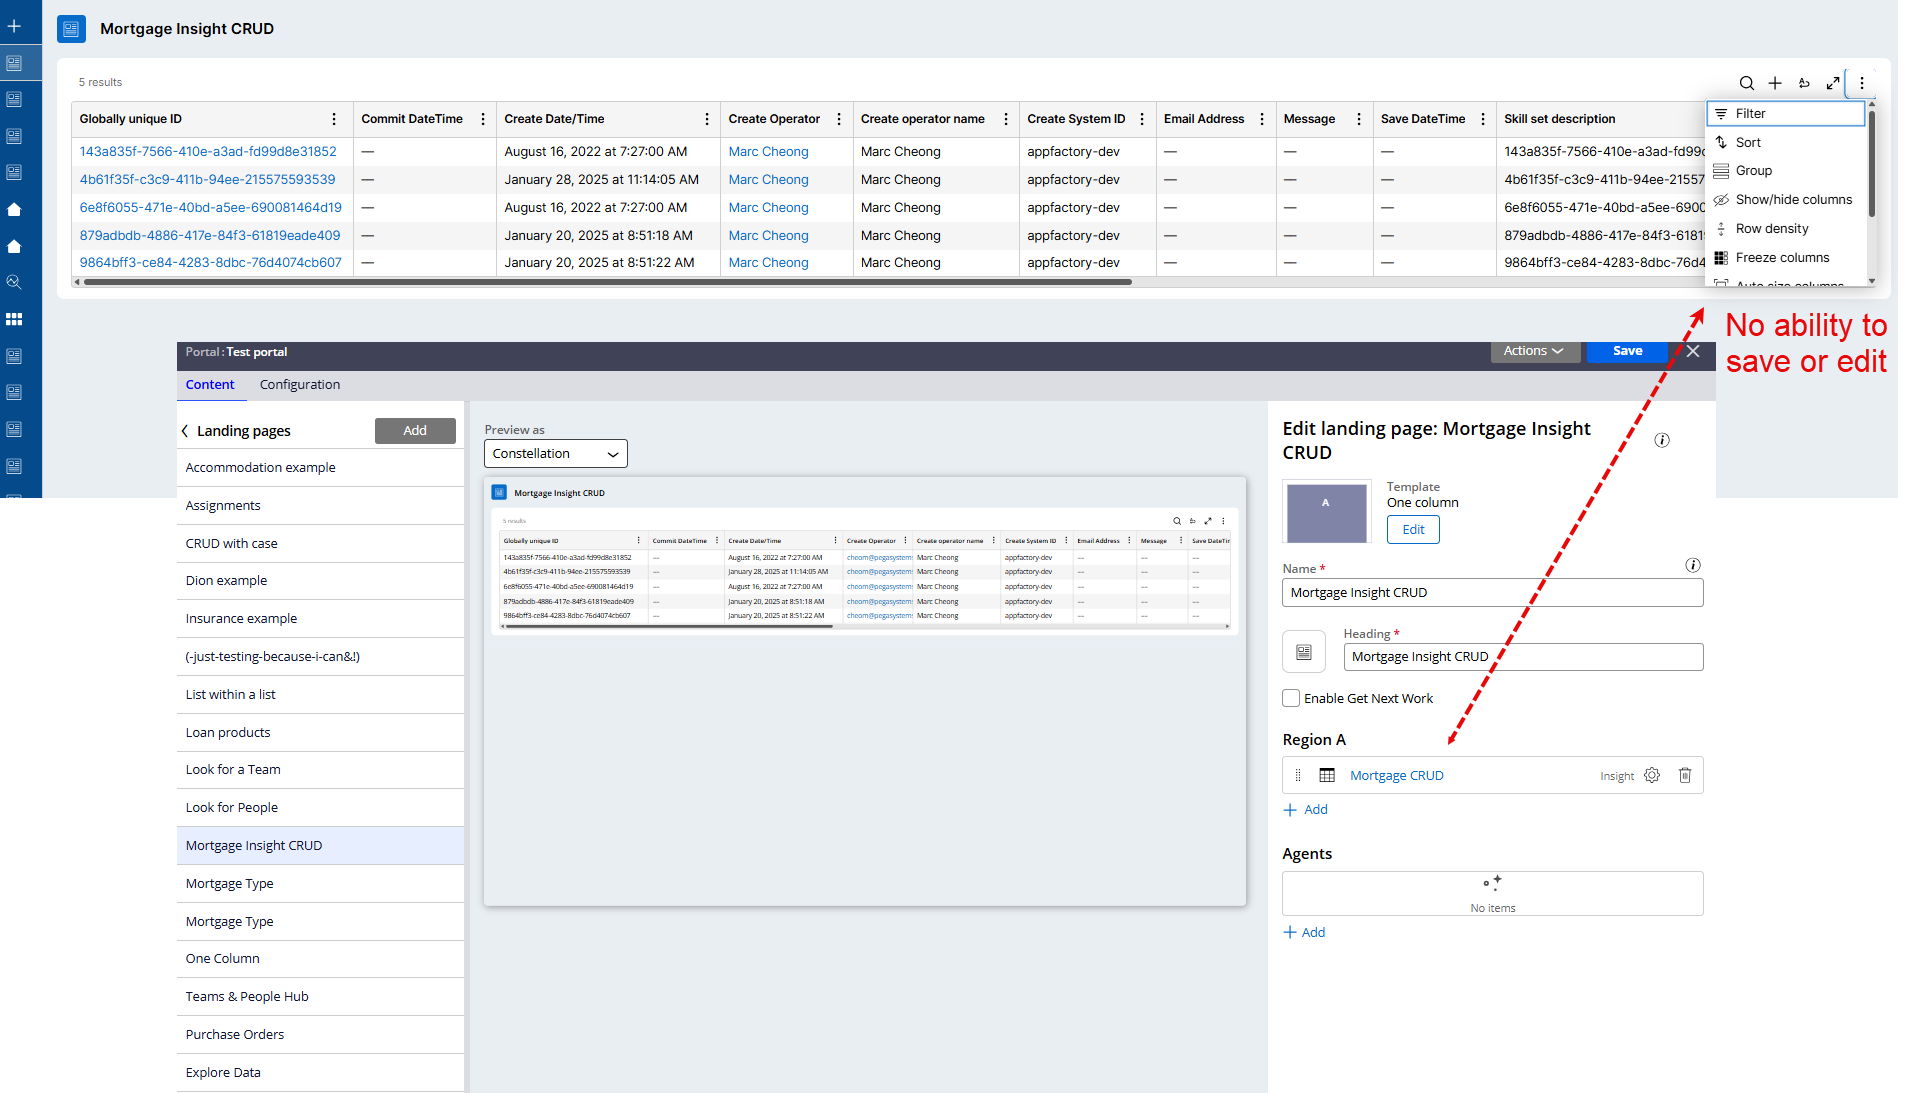
No need to look at List views into Insights etc. (not possible)
UNUM Group
US
@MarcCheong Thanks , currently we have around 20 Insight Reports , if we put all of them in one landing page everything will be rendered on page load and we cannot have 20 separate landing pages . any option to load these 20 reports in landing page only on demand ?
Pegasystems Inc.
GB
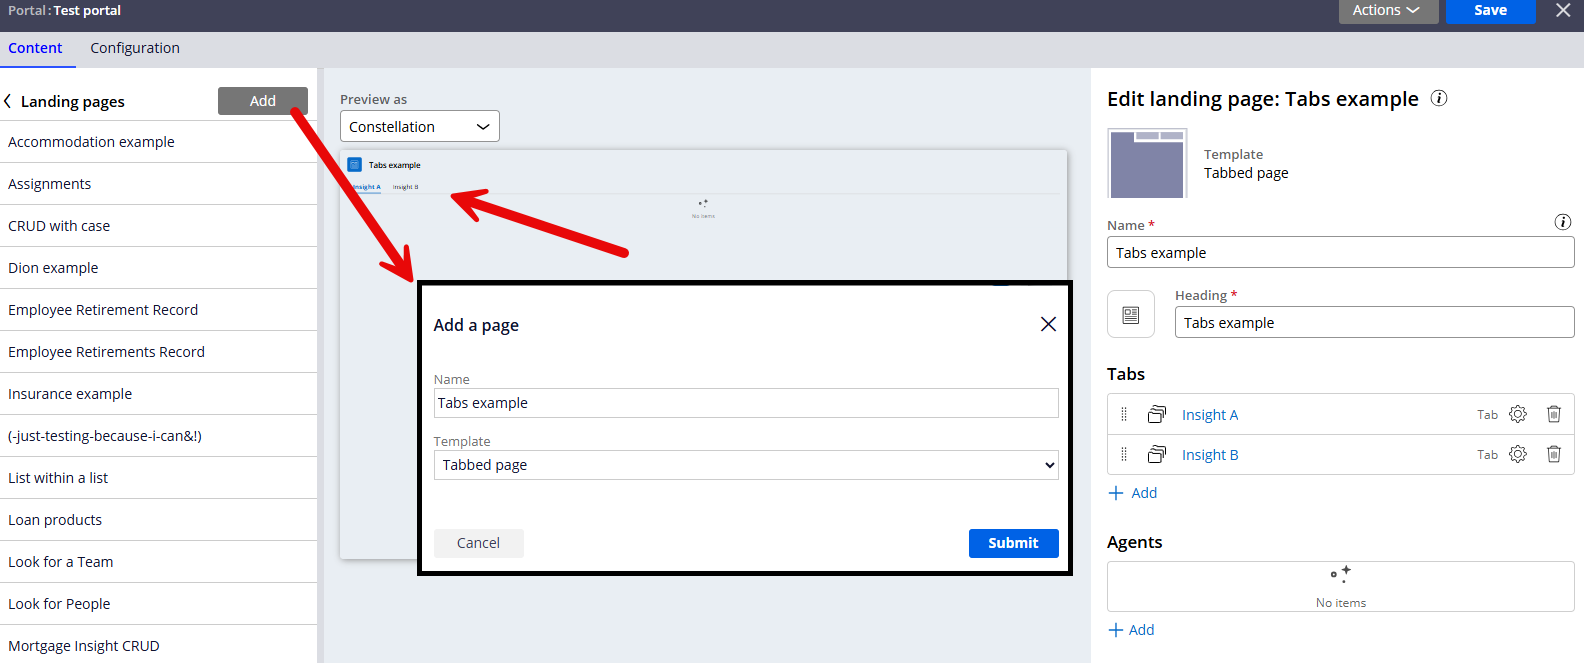
@Adithya_A you have two options in my opinion.
Landing Pages
- Create a single landing page
- Us a tabbed temple to include multiple insights (these have deferred load built int)
- In fact, the more recent '25 demo's I've seen both with platform and blueprint are using this approach more and more. So you'll see this more often IMO
Dashboard
- Use this capability to create various dashboards showing the tables need.
- This really is the same as landing pages, BUT dashboards have a nice list as a table, so might be better navigation if you want to group up various insights together.
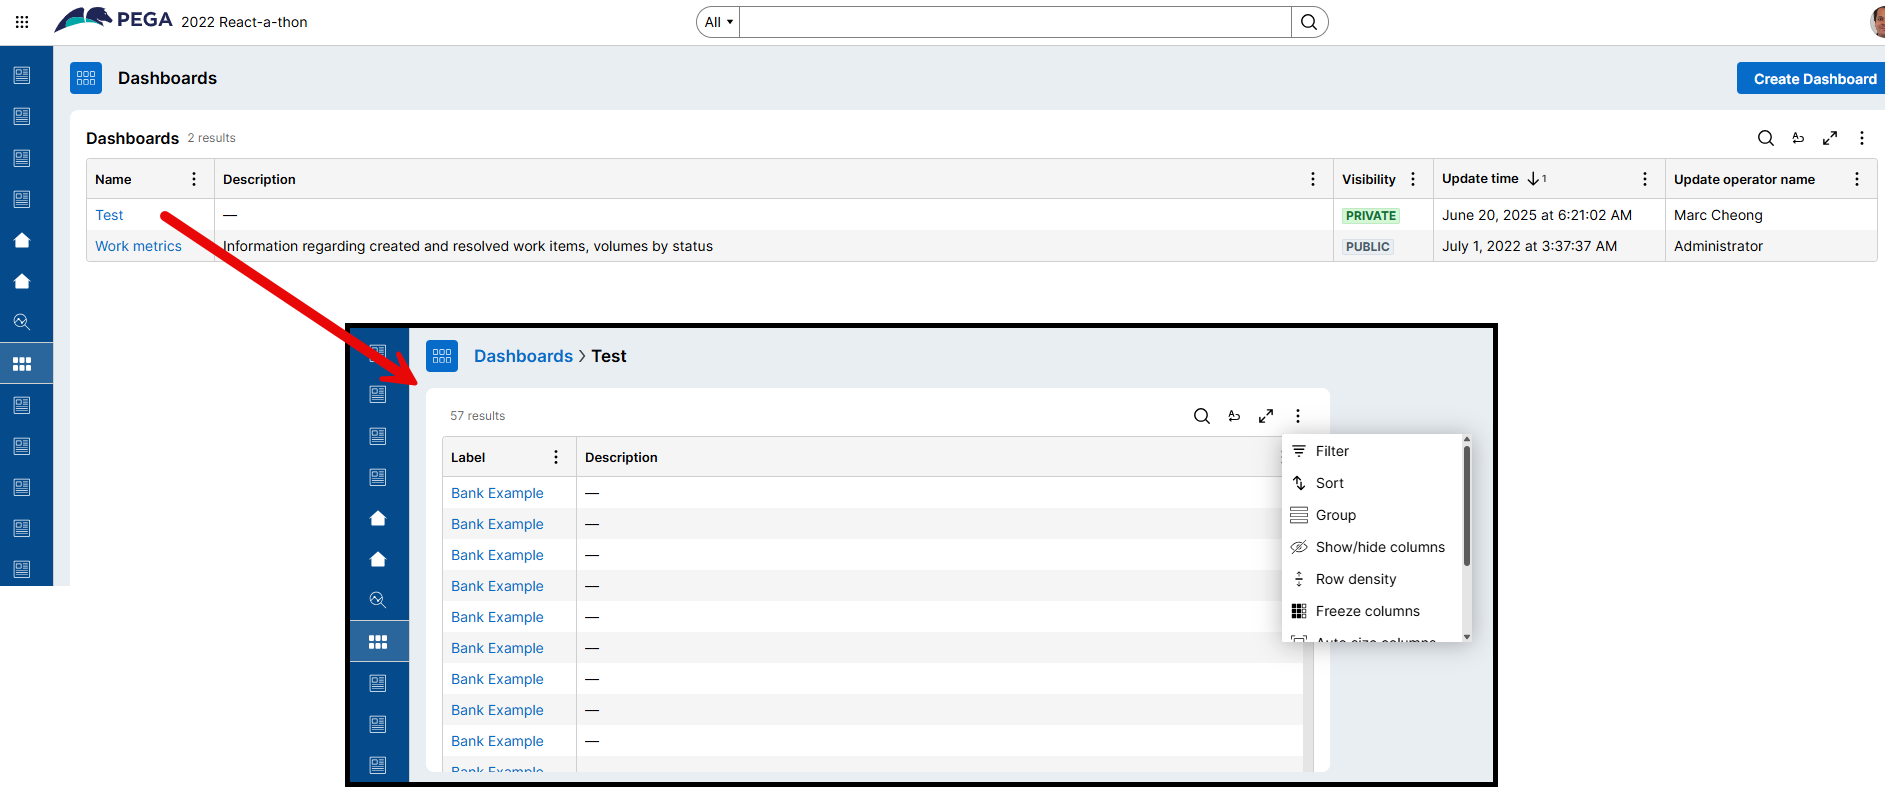
My opinion?
I prefer dashboards, its a nice safe space for putting and grouping lots of insights together. You will likely have enough landing pages for other requirements without Insights getting in the way of that and making the portal confusing for users.
@Adithya_A you have two options in my opinion.
Landing Pages
- Create a single landing page
- Us a tabbed temple to include multiple insights (these have deferred load built int)
- In fact, the more recent '25 demo's I've seen both with platform and blueprint are using this approach more and more. So you'll see this more often IMO
Dashboard
- Use this capability to create various dashboards showing the tables need.
- This really is the same as landing pages, BUT dashboards have a nice list as a table, so might be better navigation if you want to group up various insights together.
My opinion?
I prefer dashboards, its a nice safe space for putting and grouping lots of insights together. You will likely have enough landing pages for other requirements without Insights getting in the way of that and making the portal confusing for users.
Also, reporting and insights is more advanced users, they can usually deal with more complexity around the tables and groupings than a more occasional user who might be overwhelmed by so many landinge pages and tabs.
Pegasystems Inc.
JP
Great article, very helpful.
I have a question I’d like to ask. why do you have to uncheck "Allow querying any column", is it necessary?
Thank you
Pegasystems Inc.
GB
@xueh1 it is necessary, when I was creating this article, I missed this step and it didn't work.
In the past, this checkbox referred to "searchable datapages" but for the last few version it has been named so. I'm not an engineer on the platform so I can't give you the full technical explanation. However, for me, this is to do with performance, and you'll see that most of the Constellation functionality is tied into when this is enabled (to allow filtering, sorting, etc.).
In our case, we want Pega not to undertake this optimisation of the datapage and explicitly join data together - so we need to turn that off.
- I would not recommend this against OOTB datapages created when you create your Case/Data Objects as it will impact other Constellation features. Instead if you want to join data, you should create your own datapages for that purpose.
Some articles on the topic:
Pegasystems Inc.
JP
Thank you, very helpful
Bank of Queensland Group
AU
Hi @MarcCheong,
Thanks for this post!
I have a couple of questions: We are on PEGA cloud and upgraded our application from 8.x to 24.2 currently. However, the application is based on Theme-Cosmos and has not been upgraded to constellaton. However, the landing pages are rendered using constellation (setting on application rule). With that in context:
If I have a class called Org-Process-Work and I create a datapage in it called D_WorkList and check the 'Allow query using JSON object' checkbox and source the data from a report definition then the results are shown correctly.
- However, if I uncheck the 'Allow query using JSON object' but keep the report definition as source then I get error on UI and in logs and no data is retrieved. --> This also means that I am not able to use the multiple embedded pages for non-queryable data page.
- Similarly, I tried to use a source other than a report definition but got an error as well.
Have you encountered above issues? Can you share some screenshots wherein you have used a data source other than a report definition and used the non-queryable data page as source?
Cheers!
Pegasystems Inc.
GB
@SMSMSM some great questions!
Insights
I'd be keen to understand what you are trying to achieve - multiple embedded pages? So a Case > Client > Address type scenario for your Insight or Landing Page? I think the problem you are going to run into is Insight only goes to "Client" in my scenario.
- Support for multiple levels of Embedded Data was released in 24.2 https://docs.pega.com/bundle/platform/page/platform/release-notes/repor…
List Views
If you're looking at Landing Pages and List Views, then the scenario I outlined "Using Class Joins" could be a way for you to join or flatten the data? The important thing to note is the the Traditional "pxPages" approach is not supported at Design or Run Time, so you need to copy this into an actual data model on your object.
@Aditi Mehta has also posted a variation, around the work- level that might help? https://community.pega.com/conversations/user-experience/visualizing-da…. Though it doesn't cover the embedded data scenario.
Start a Conversation with the Expert Circle?
If you have a more detailed scenario, screenshots etc. and feel up to posting it all with what you are trying to do, you could ask our new Expert Circle? I think this would be a great use case to share with our community.
Bank of Queensland Group
AU
Hi @MarcCheong,
I am trying to evaluate the effectiveness of creating an insight vs a traditional report definition, both from a development and end-user-friendliness basis.
Therefore I am trying to understand the below:
1. Can an insight source data from anywhere (and not just the database) using an activity/data transform as source and flatten the data to display in the insight report
2. Does non-queryable data page work as a source (I could not make it happen) and if yes then how can I leverage a PageList.Page.property?
Pegasystems Inc.
GB
@SMSMSM comparing the two can be tricky as they are two very different features - trying to think about Insights like a Report Definition may lead you to make the wrong conclusions. In my opinion, Explore Data and Insights is geared towards self-service, the business should be fully self sufficient on their reporting needs without the need to wait for developers to create them operational reports.
To go direct to your questions.
- Insights are sourced against the object itself (case or data), it does not use an activity, nor data transform to populate. These are sourced via a Virtual Report Definition based on the object setup (see Settings tab > Default Data sources). However, that datapage is not the true source of all information, there is more going on in the background than even I know about here - the datapage is just a starting point for this Virtual Report Definition to populate.
- Non-queryable data does work - however, that can only be accessed via an Author access group, via App Studio running of Explore Data (not an end user portal). You can source your datapages for an insight there > but i believe they can only be set to "Admin" access and not used by real users in Explore Data...
- It's actually are really important point, App Studio running vs End User Portal running of Explore Data can result in different outcomes (due to access differences).
Right now, as of 24.2.2, Explore Data supports the following (https://docs.pega.com/bundle/platform/page/platform/release-notes/repor…)
- Queryable Data Pages
- Page.property
- Page.Page.property
- PageList.property
- Non-queryable Data Pages
- Page.property
- Page.Page.property
- PageList.property
- Page.PageList.property
- PageList.Page.property
Updated: 29 Jun 2025 8:28 EDT
CPF
SG
@MarcCheong Hi Marc, thanks for the detailed writeup.
I want to check if you know how to disable the explore tool feature, as even after I remove the landing page, the user is still able to access via the url link.
I have set Data-Portal_pzDataExplorer privilege to 0.
The reason is to disable the button to create insights as it allows the preview of the backend data and the columns, even if the user wouldn't be able to save the insight.
Currently even with the privilege set to 0, the preview of the data allows sensitive data that user should not have access to be seen.
Pegasystems Inc.
GB
@SvenKrow you can not disable the Explore Data button, it's a common ask but Explore Data is intrinsically linked to creating and viewing Insights. If you want to show insights without allowing all the create and save as features, then using Dashboards is the way to go.
IF you are saying that removing the portal and the privilege still allow someone to access the Explore Data landing page? Then this has to be a bug, and I would be raising that to Pega Support.
Pegasystems Inc.
AU
Thanks for the detailed info on eInsight. I'm trying to use the OOTB "Number of work items created daily" eInsight but I need to config the case types to appear on the report. The report is using the object "All work in my application" but I can't work out how the system determines the list of case types in my application. Do you know how I can change the case types included in the "All work in my application" object?
Thanks.
Pegasystems Inc.
GB
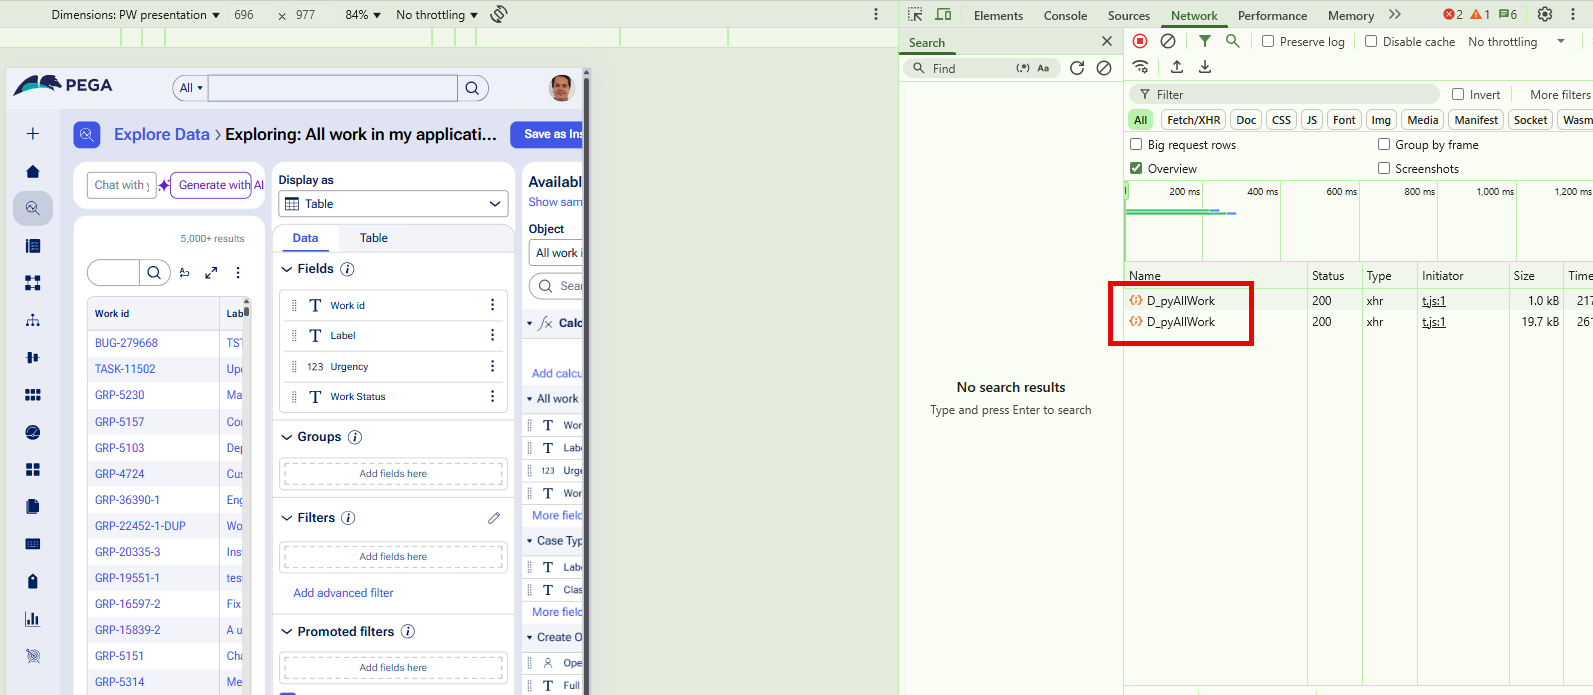
@tungt have you checked the console? It seems to be running D_pyAllWork. This should be all cases in your current application?
If you're missing items, i'd suggest looking at your Application Rule, see what cases are defined there. If not, look at your pyRoutingTable, see what cases are defined there, this is a common one for issues with Constellation as most people do not regenerate this. My next Constellation 101 series is going to be on the Routing Table to explain this more :)
In constellation, both/either of these controls what cases Constellation knows to be "in your app".
Pegasystems Inc.
AU
Thanks for the reply. Yes, I think it is D_pyAllWork alright. What I found was that the underlying report is just using the case types of the default workpool because it hasn't used Include all descendent class. My App has multiple built-on apps AppA -> AppB -> AppC and all the case types in AppA and AppB are inherited from the workpool in AppC. The default workpool of my AG is that of AppC and so D_pyAllWork doesn't include any of the case types in AppA and AppB. I guess this is strictly report definition issue, not eInsight. However, if I changed the report in D_pyAllWork to use include all descendent classes, it was able to give all case types in AppA and AppB as well, but then while the chart "Number of Work Items created daily" now showed all case types, the drill down is way out of whack. For example, it shows a case type having certain number created on certain day, but when I drill down on it, it doesn't show anything, or what it shows doesn't match the count. This looks like eInsight issue.
Anyway I'm going to log an INC with this drill down issue and see what engineering says.
Thanks
Pegasystems Inc.
GB
@tungt yeah, definitely raise an INC with Pega support. Might be pushing the boundaries of Insights a little, my first check would be that the cases are defined on your Application (even if they are inherited from the stack), as this controls a lot of Constellation features.
I know the Product team are working on allowing you to control the drill through in 25. Although, i'm unsure if that would fix this specific issue.
Other solutions?
As for other solutions, you could build your own datapage? This might give you more control to define exactly what you want to show in the insight without using decendent classes.
- We recently published and example for Insights on class group: https://community.pega.com/conversations/user-experience/visualizing-da…
Pegasystems Inc.
AU
Another mystery with eInsight is that some data pages don't appear for Explore Data. I have created a data page in my work pool, make sure it has no parameter, no security required, of List type, using a report as source without response DT and the "query any column" checkbox is ticked. Yet when I go to Explore Data, I click the Explore Data button, navigate to and expand Data Pages >, then expand my work pool class but I cannot find that data page. I've logoff, login, clear my browser cache, use new browser session, try both Edge and Chrome and still the data page doesn't appear. Any idea of why this is happening?
Regards
Pegasystems Inc.
GB
@tungt only datapages that do not have "query any column" checkbox ticked will show up in that menu.
A side note, as it came up in a conversation I was having last week. As an App Author, you have access to two different "explore data" experiences.
- Design Time (App Studio experience)
- Run time (end user experience)
Datapages won't show for run time end user experience. So you have to be careful which one you're running as a developer.
Might be relevant for you, might not, worth a mention.
Pegasystems Inc.
US
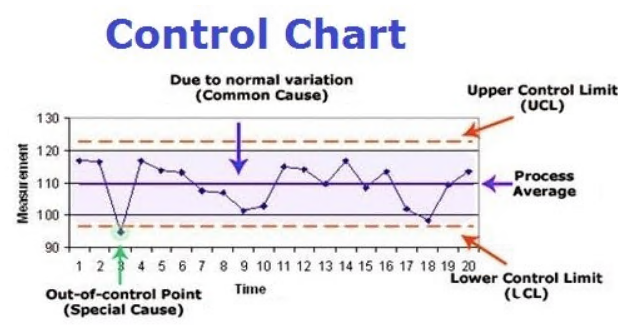
An awesome write up @MarcCheong ,
Do you have any suggestions for building an Insight to show not only values over time but some way to highlight variances above and below a control limit? Would this need to be two separate Insights?
Pegasystems Inc.
GB
@DaveFinleyyes, this is certainly possible. So long as the "measurement" in your image is a value on the case, you can run this in 24.2.2 - possibly earlier but that is the version I am using right now.
- In '25, we introduce calculations, which would mean you wouldn't actually need the value on your case either
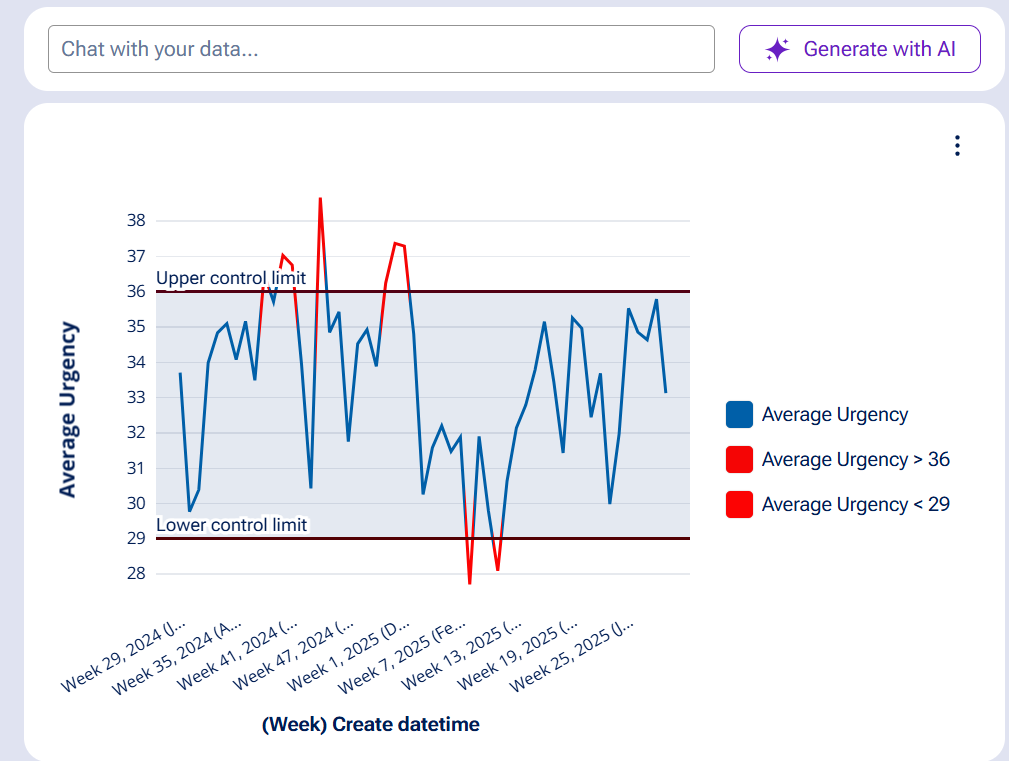
Let's assume it is a value, its straight forward, for my demonstration below, I was mapping average case urgency per week over time. My upper limit urgency was 36 and lower 29.
Hopefully these instructions make sense:
@DaveFinleyyes, this is certainly possible. So long as the "measurement" in your image is a value on the case, you can run this in 24.2.2 - possibly earlier but that is the version I am using right now.
- In '25, we introduce calculations, which would mean you wouldn't actually need the value on your case either
Let's assume it is a value, its straight forward, for my demonstration below, I was mapping average case urgency per week over time. My upper limit urgency was 36 and lower 29.
Hopefully these instructions make sense:
- Open Explore Data
- Explore the Data Object you want to run the Insight on
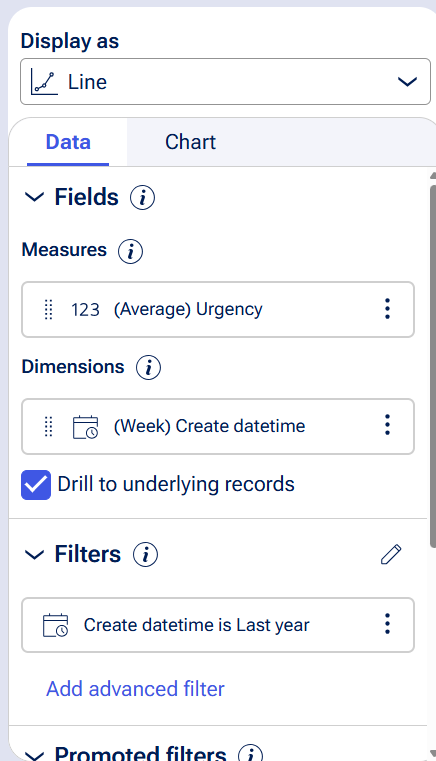
- Default it will be a table, change the 'display as' to chart.
- Select line
- In the 'measures' field you will have count by default. Add the value you want to measures and remove default
- Click the 3 dot 'hamburger' menu on your value and change it from the default "count" to "average"
- Important note, the field you are running this on should be an Integer or Decimal for this to allow 'average'. Always important to get your data model right in Constellation so it knows what options and rendering to display in the UI and configurations like this.
- In the 'dimensions' field add 'create data/time'
- Click the 3 dot 'hamburger' menu on this dimension and select 'relative date parts' > 'weekly'
- At this point you should have a line chart showing the values over weeks.
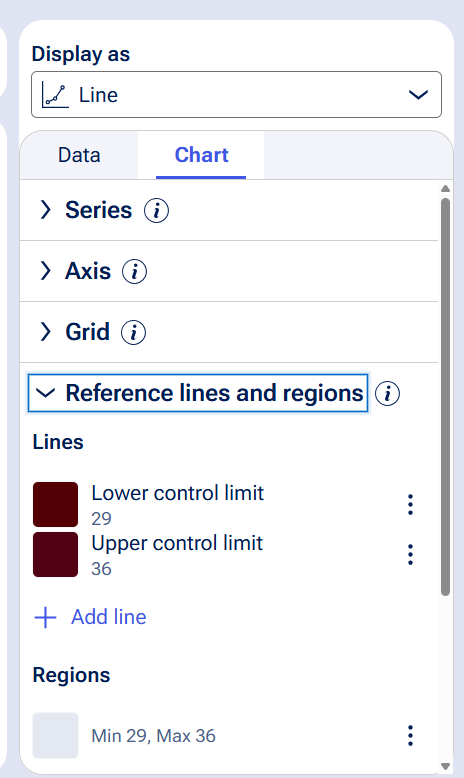
- Now to configure your upper and lower limits
- Just under 'display as', there is 2 tabs. Select 'chart' (default would of been 'data' that you were working in prior)
- Expand 'reference lines and regions'
- Click 'add line'
- Add 2 lines with a configuration for the values you want and label appropriately
- Now, we want to add a 'region', this will be the shaded area. It has a min and max, along with label and colours like before.
- Now, for bonus points, I'll even given you some alerts when you are outside your limits...
- Expand 'conditional formatting'
- Click 'add condition'
- Add 2 conditions. One for above your limit and one for below your limit.

Happy days. Hope that helps!
Zurich
US
@MarcCheong - We have implemented the associations and the source to the insight is a D page-> Report Definition (assign-worklist)-> Mapped Response DT(for pxpages (). I am able to add the columns, but the link to the reference key /case ID is not enabled though it has been configured as additional details.
When I enable Allow query column that's when the link is enabled , but the mapped data from response DT will not work.
Could you please help with this .
Pegasystems Inc.
GB
@kowshikatwhat you are observing is correct - when you use queryable datapages the response datatransform will not run. That is why in the steps above I cover to uncheck this, as you are creating a datapage to directly access, instead of using Insights virtual report definitions
- "2.Ensure Data Page has "Allow querying any column" unchecked"
As far as I am aware, your options are:
- Don't tick this (and use Datapage directly in Insights, instead of Explore Data on the Assign- Data Object) OR
- Create a List View, which can reference a datapage directly.
Transavia
NL
@MarcCheong Thanks a lot for these details, we recently started using the tool as well, and the feedback has been amazing so far!
One thing we struggle with though, is the naming of objects under the 'Explore Data' button. The name of these objects is being fetched from the Rule-Obj-Class label, which is something we rather not edit in few use-cases. The result is that we have unclarity for our users about which object they are reporting on. Especially if it's a class group, or a case with a similar name. We rather give these a more useful label to help out.
Are there any plans to introduce custom labels for this Explore Data dropdown? Or any workarounds I might be missing?
Thanks!
Pegasystems Inc.
GB
@DaniW701 you are correct, the rule-obj-class label will dictate much in Constellation, including the Explore Data menu. It is always good practice to label your data and cases with business friendly names.
I am not aware of any changes coming for Explore Data here, however, the need to override labels has been acknowledged in other places in '25 like below. So I wouldn't rule it out 100%.
- Labels on Embedded Data https://docs.pega.com/bundle/platform/page/platform/release-notes/user-…
Curious what your use case is? Why you can not just edit the class label to get the desired business friendly name? This would be the easiest thing.
- I know in the case of Common Application entities, there is some differences here, where they do not allow you to edit the name. This is something I know the team is aware of and looking at making that more flexible. Is your limitation because of Common Application (Common Data Model)?
Nihon Insight Technologies Corporation
JP
Thanks for the detailed post — it has been very helpful!
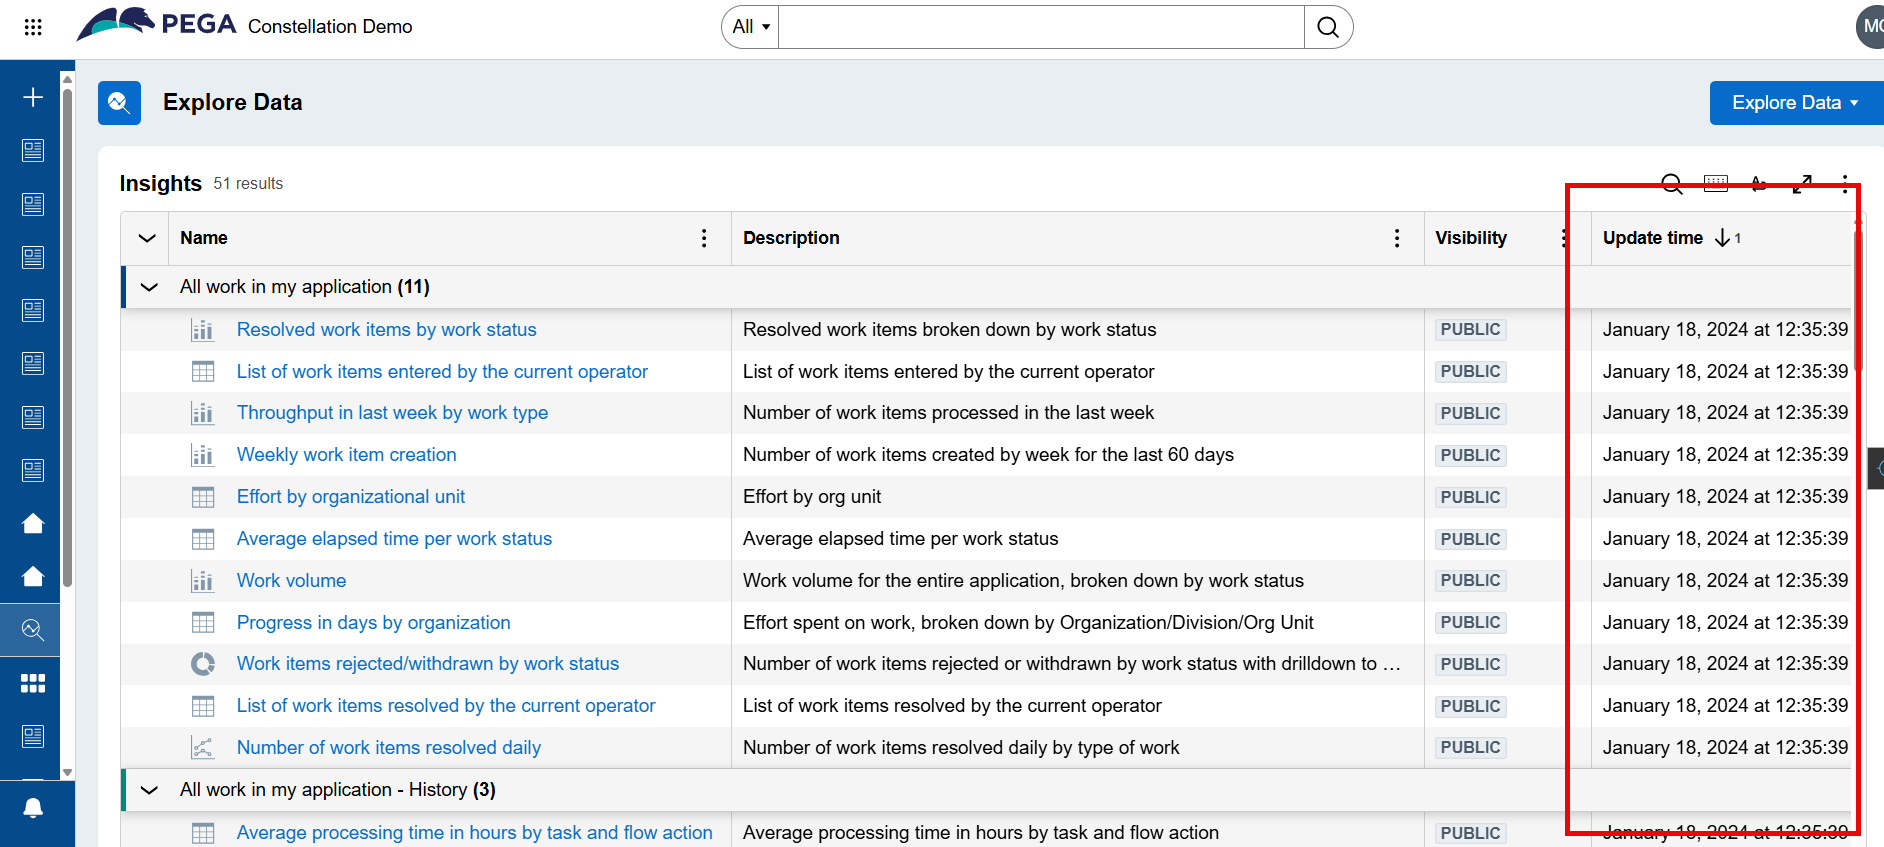
I have some questions regarding Explore Data. I noticed that Insights are sorted by Update Time and grouped by Class by default on both design time and run time Explore Data.
- Is there a way to disable this default sorting and grouping? Is this behavior part of the ExploreDataPage template (or governed by the pzMyInsights report definition?), meaning these defaults cannot be modified?
- If so, does that also imply it is not possible to configure which columns are shown or hidden by default on Explore Data?
I understand that Explore Data is designed as a self-service landing page, and that creating a custom view and then marking it as default could address these needs.
However, since multiple users want the same explore data view, I would like to know whether there is any configuration allowing to clear these default settings.
Thanks you.
Pegasystems Inc.
GB
@Tae17y interesting question! I haven't heard anyone ask that before.
For context, I think you're asking about this page?
OOTB solutions:
- As you say, this is just a regular Constellation Table, so Personalization is allowed, people can default and filter as they need.
- If there are "common" insights people want, then they could build dashboards just focused on those ones
- In the future, likely '26, I have already seen a "Recents" section so you can find your common used ones.
I would say Update Date is probably appropriate, I common get asked about people finding "new insights" and this is how we do it. That said, IF you did want to explore, personalizations are data and they are stored in System-User-Grids. You could look to do something more advanced to change a default for people...
- See related post on this https://community.pega.com/conversations/user-experience/accessing-a-pe…