List View: Configuring a Table display
Video:
Why:
The Tables component in the Pega Constellation Design System is designed to display and manage data in a clear, organized manner. It allows users to efficiently manage data by sorting, filtering, and paginating large datasets. The component supports interactivity through features like sorting, filtering, and inline editing, and it adjusts responsively to different screen sizes. Developers can configure tables to add custom columns, styling, and integrate with other components, with options for dynamic data loading to enhance performance. Benefits include a unified user experience across applications, efficient data handling, and a modern, responsive UI that meets current user expectations.
Purpose and functionality:
- Data Display: The primary function of the Tables component is to present data in a clear and organized manner, using rows and columns. This format is intuitive for users, as it mirrors common data presentation methods like spreadsheets.
- Data Management: Beyond just displaying data, tables in Pega can be used to manage data efficiently. Users can perform actions such as sorting data by columns, filtering rows based on criteria, and paginating through large datasets.
- Sorting and Filtering: Users can interact with tables by sorting data in ascending or descending order, and filtering to show only the relevant subsets of data. This makes it easier to find and analyze information.
- Editing: Rows can be configured to be edited via a modal, without navigating away from the page. All the CRUD operations can be easily configurable for a table.
- Responsive Adjustments: As part of the responsive design, tables automatically adjust to different screen sizes and orientations, ensuring usability on desktops, tablets, and mobile devices.
- Configuration and Flexibility: Developers can configure tables to meet specific needs, such as adding custom columns, styling, or integrating with other Pega components and data sources. Tables can be set to load data dynamically, improving performance and user experience by fetching data as needed rather than all at once. Tables can easily be converted to Repeating Views, allowing for quick changes to the desired UX
Business use cases:
In a business context, the Tables component in the Pega Constellation Design System is particularly useful for scenarios where structured data needs to be presented, analyzed, and managed efficiently. Here's an explanation of how this component can be applied in a business use case.
Table View Use Cases:
-
Employee Directory:
- Purpose: Display a comprehensive list of employees with details such as name, department, role, contact information, and office location.
- Benefit: Facilitates easy searching and filtering to quickly find specific employees or departments, aiding internal communication and coordination.
-
Inventory Management:
- Purpose: Present a table of inventory items, including item name, SKU, quantity in stock, reorder level, and supplier information.
- Benefit: Allows warehouse managers to sort and filter items based on quantity or reorder status, streamlining stock management and reordering processes.
-
Project Tracking:
- Purpose: Track ongoing projects by listing project names, start and end dates, project managers, status, and completion percentage.
- Benefit: Enables project managers to sort projects by status or deadline, helping to prioritize tasks and manage resources effectively.
-
Customer Order Management:
- Purpose: Display customer orders with order ID, customer name, order date, total amount, and status.
- Benefit: Sales and support teams can filter and sort orders by date or status to quickly address customer inquiries and follow up on pending orders.
-
Financial Transactions:
- Purpose: List financial transactions with details such as transaction ID, date, amount, account name, and transaction type.
- Benefit: Financial analysts can sort and filter transactions to conduct audits, identify trends, or prepare financial reports efficiently.
Benefits:
- Large Data Sets: The user needs to analyze and compare many records simultaneously.
- Structured Information: The data is highly tabular and benefits from columnar sorting, filtering, and analysis.
- Example: Financial reports, transaction logs, or inventory management.
- Comparative Analysis: The user must compare rows directly (e.g., comparing ages, email addresses, or statuses side-by-side).
- Export or Advanced Filtering: Data is frequently exported to tools like Excel or filtered by specific criteria.
Prerequisites:
-
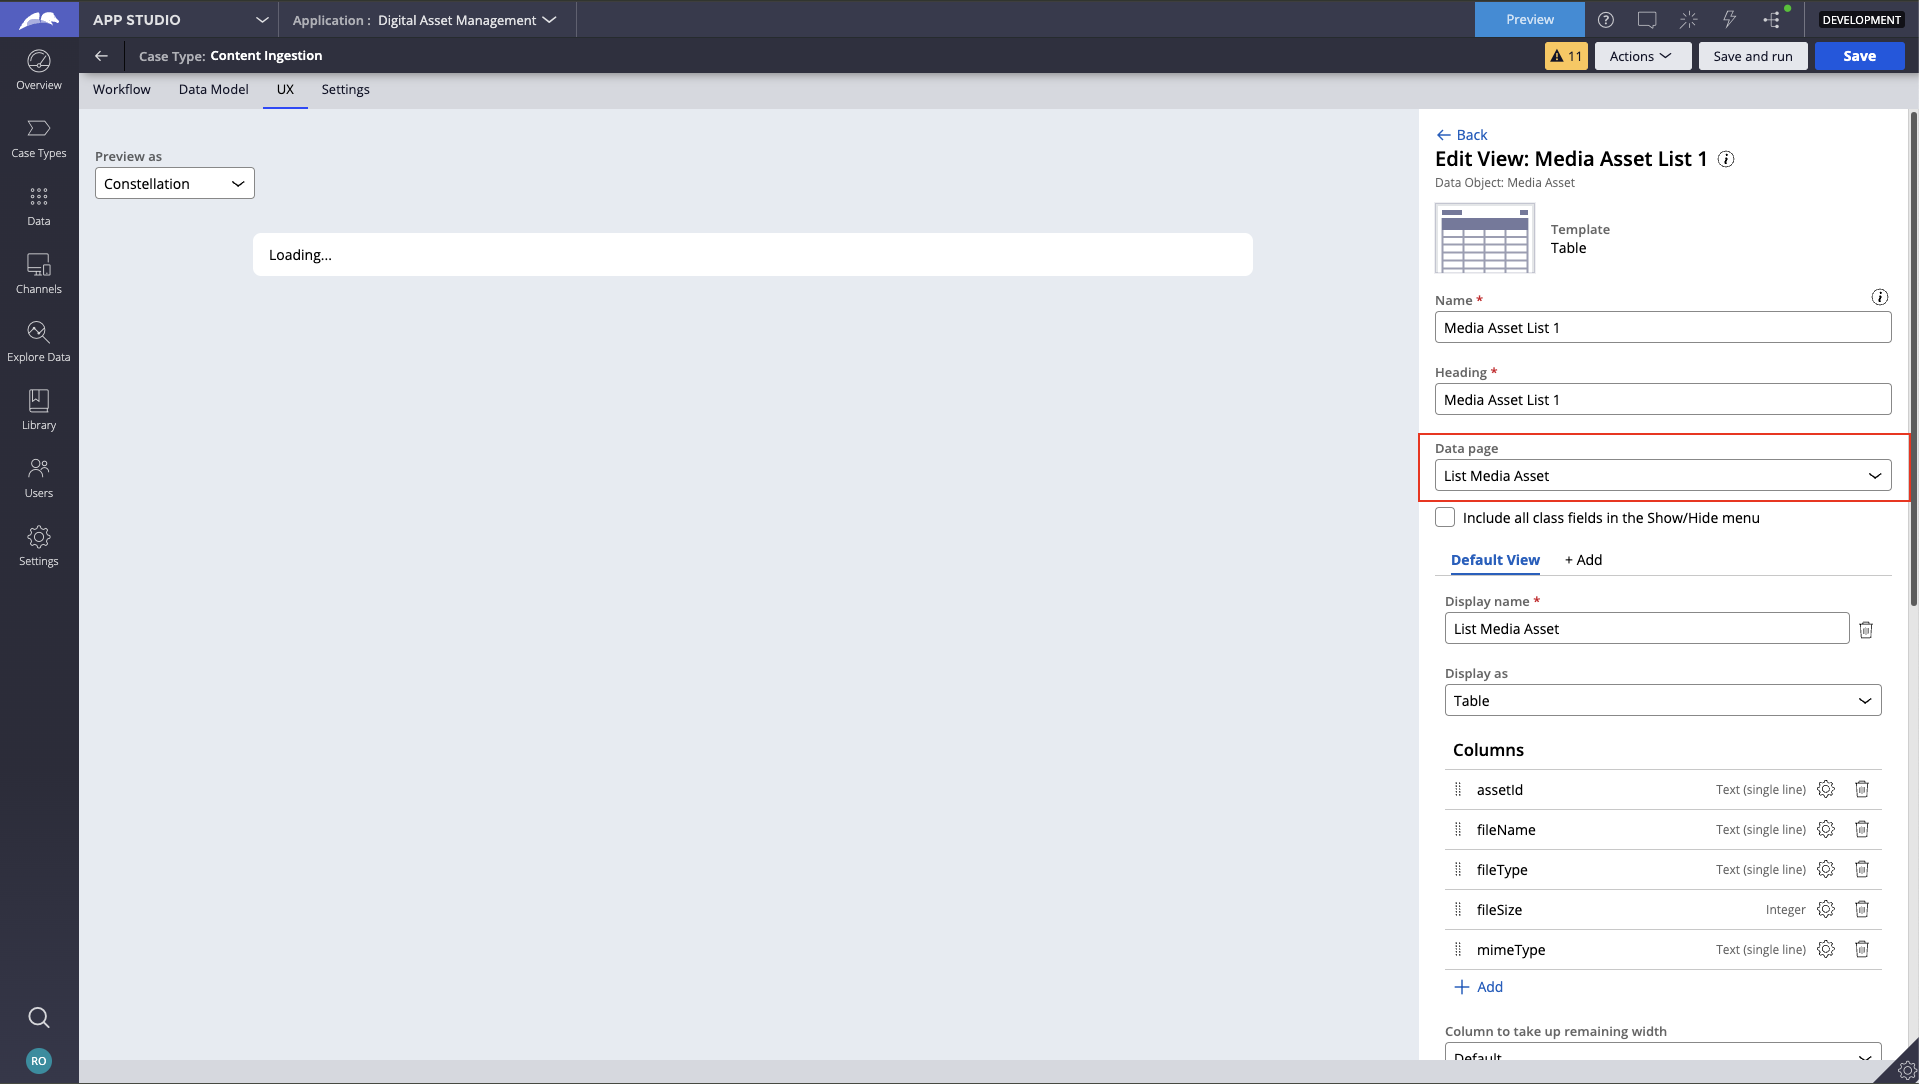
Define Data Sources:
- Identify Sources: Determine where the data will come from. This could be internal databases, external systems, or Pega's own data types.
- Integration: Set up any necessary integrations with external systems using Pega's integration tools and connectors to ensure data is accessible.
-
Create Data Types:
- Data Modeling: Use Pega’s Data Designer to define the data types you need. This involves specifying the fields or attributes that will be included in your tables.
- Data Relationships: Establish any necessary relationships between data types to support complex data structures (e.g., one-to-many relationships).
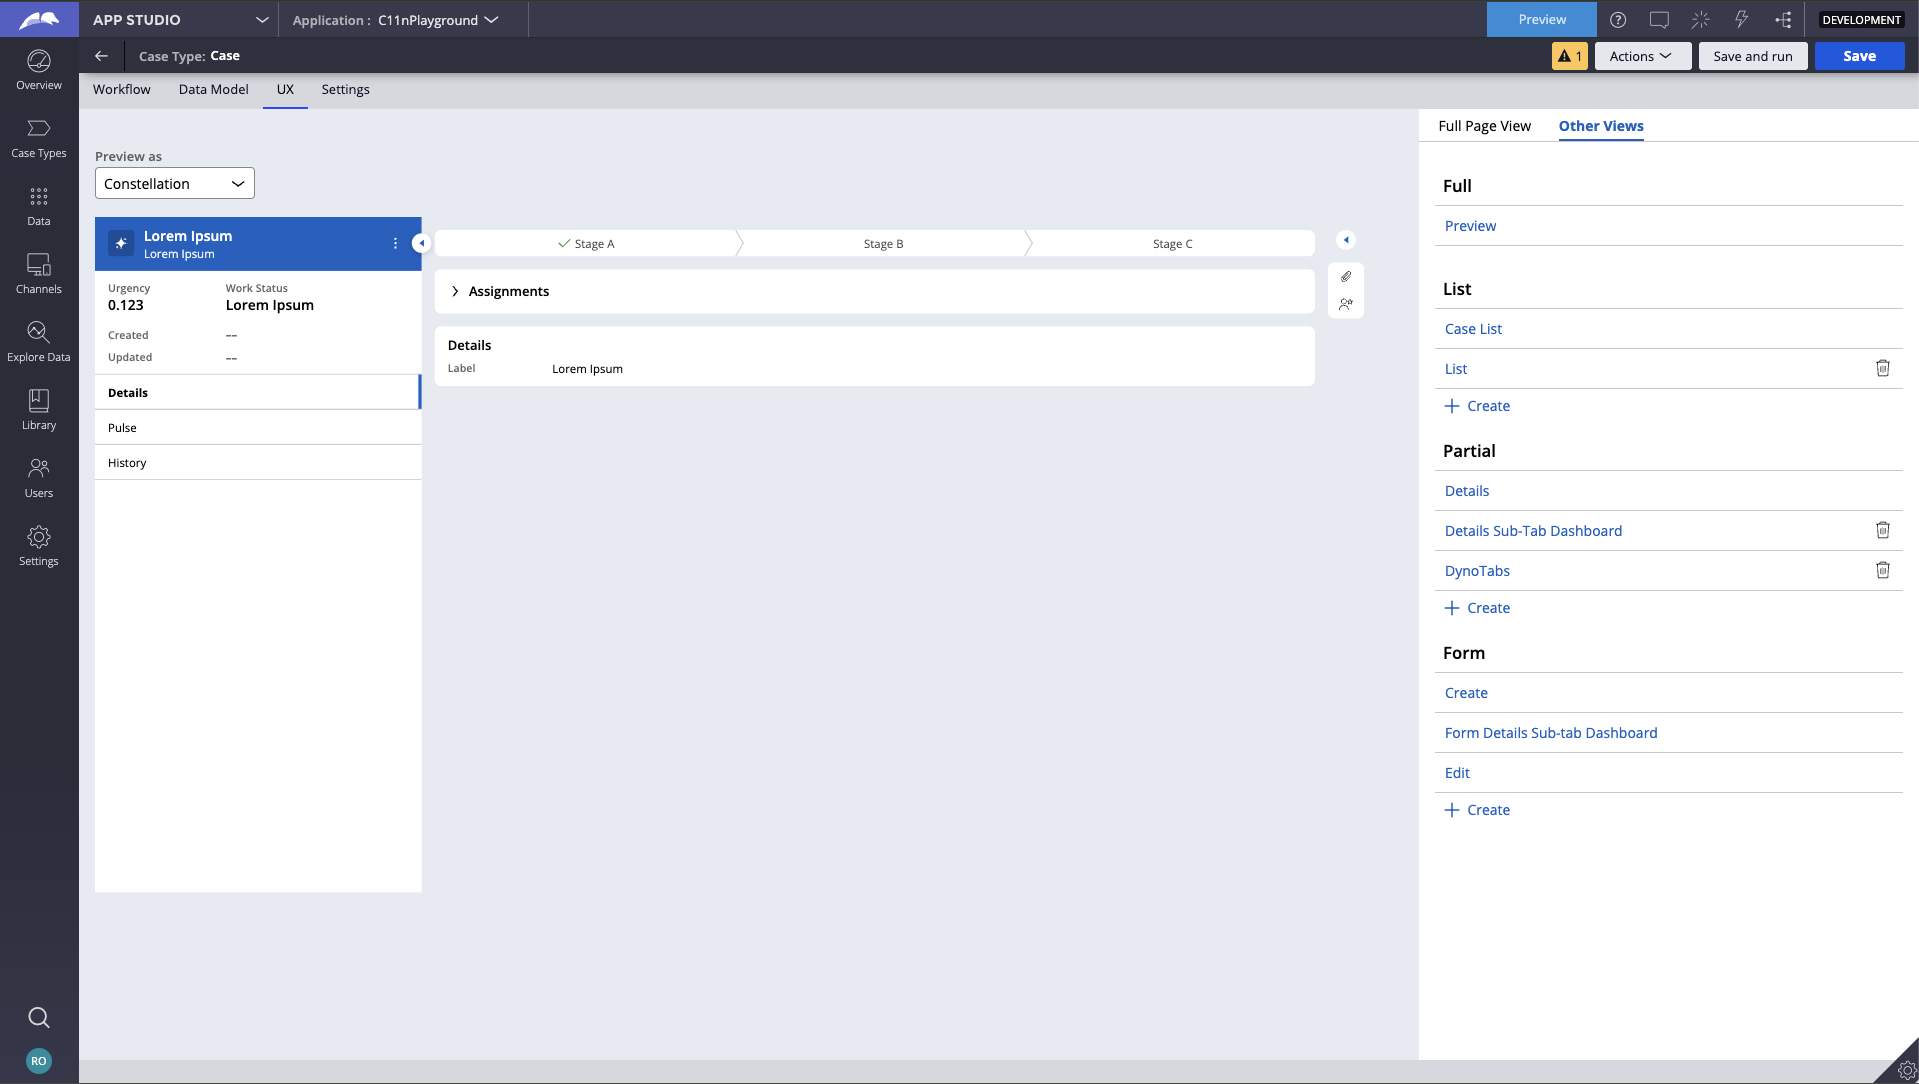
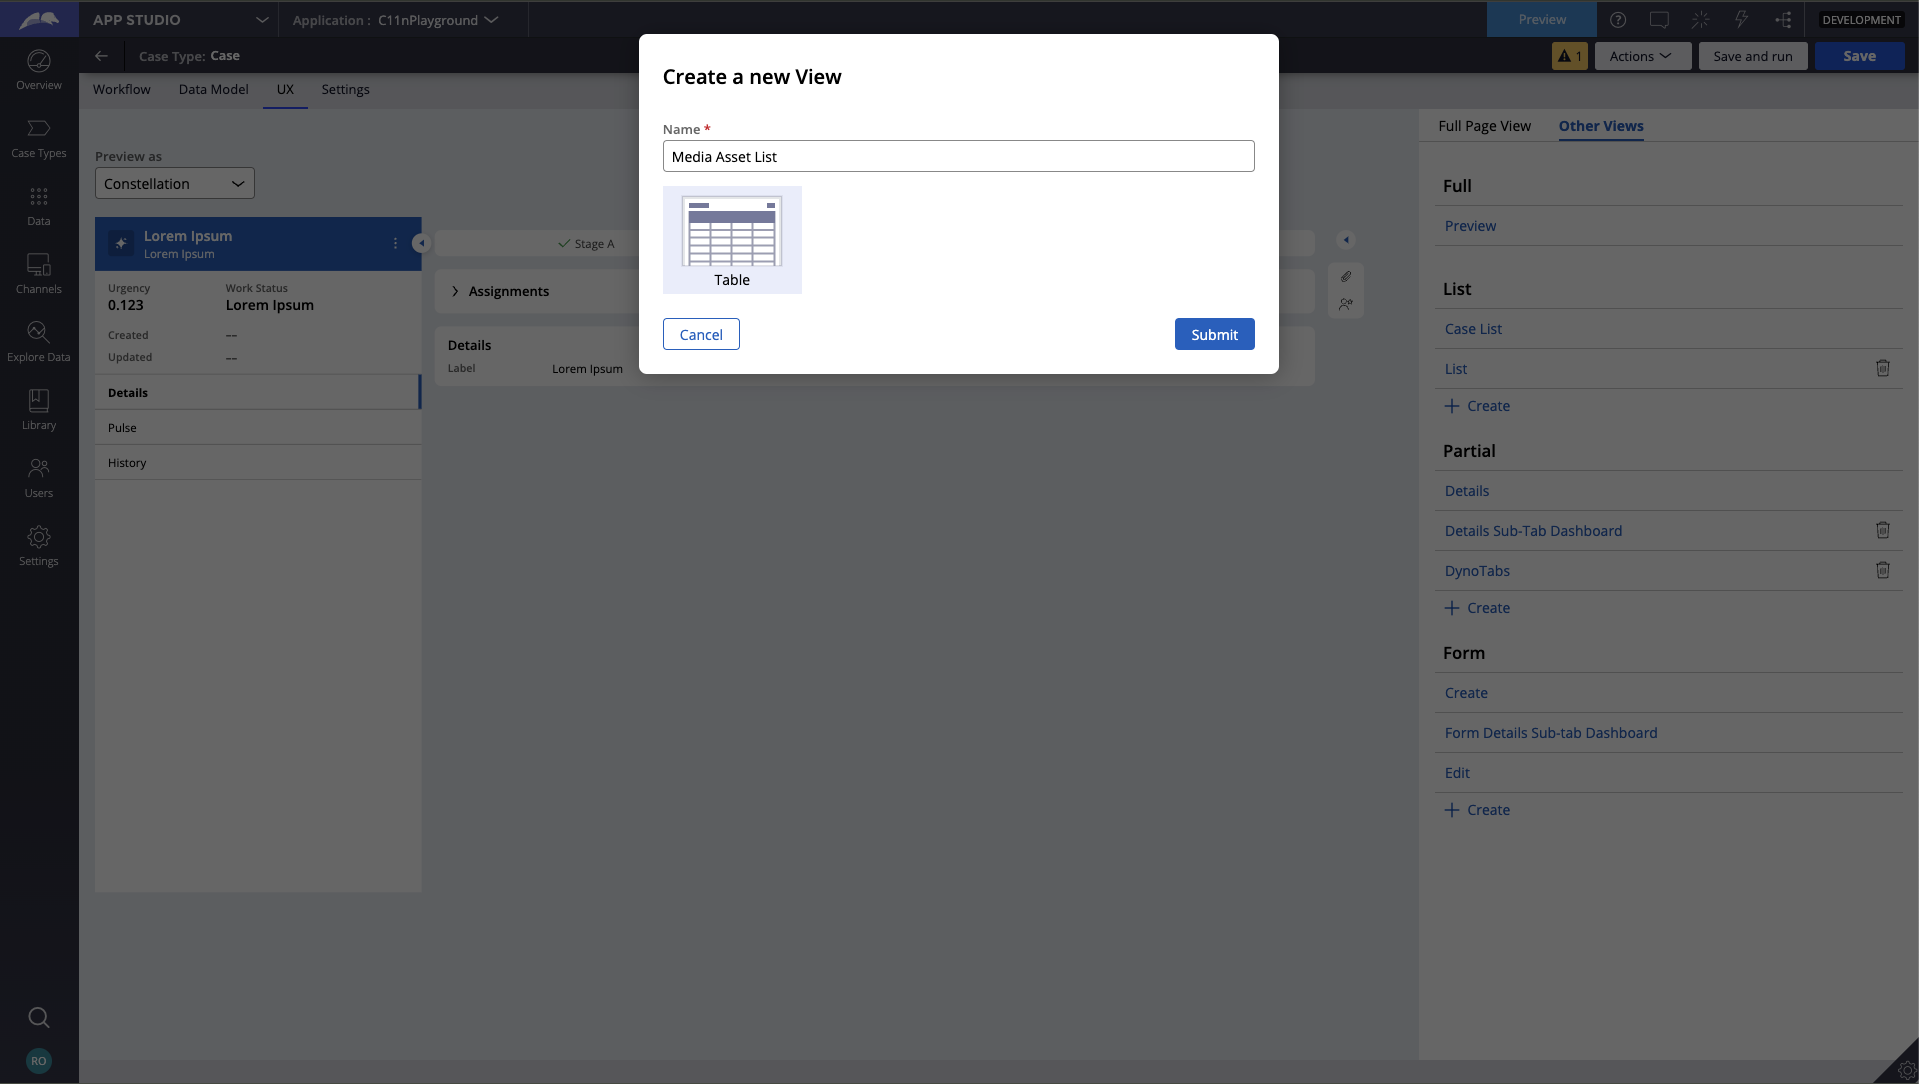
Configuring – Tables and List Views
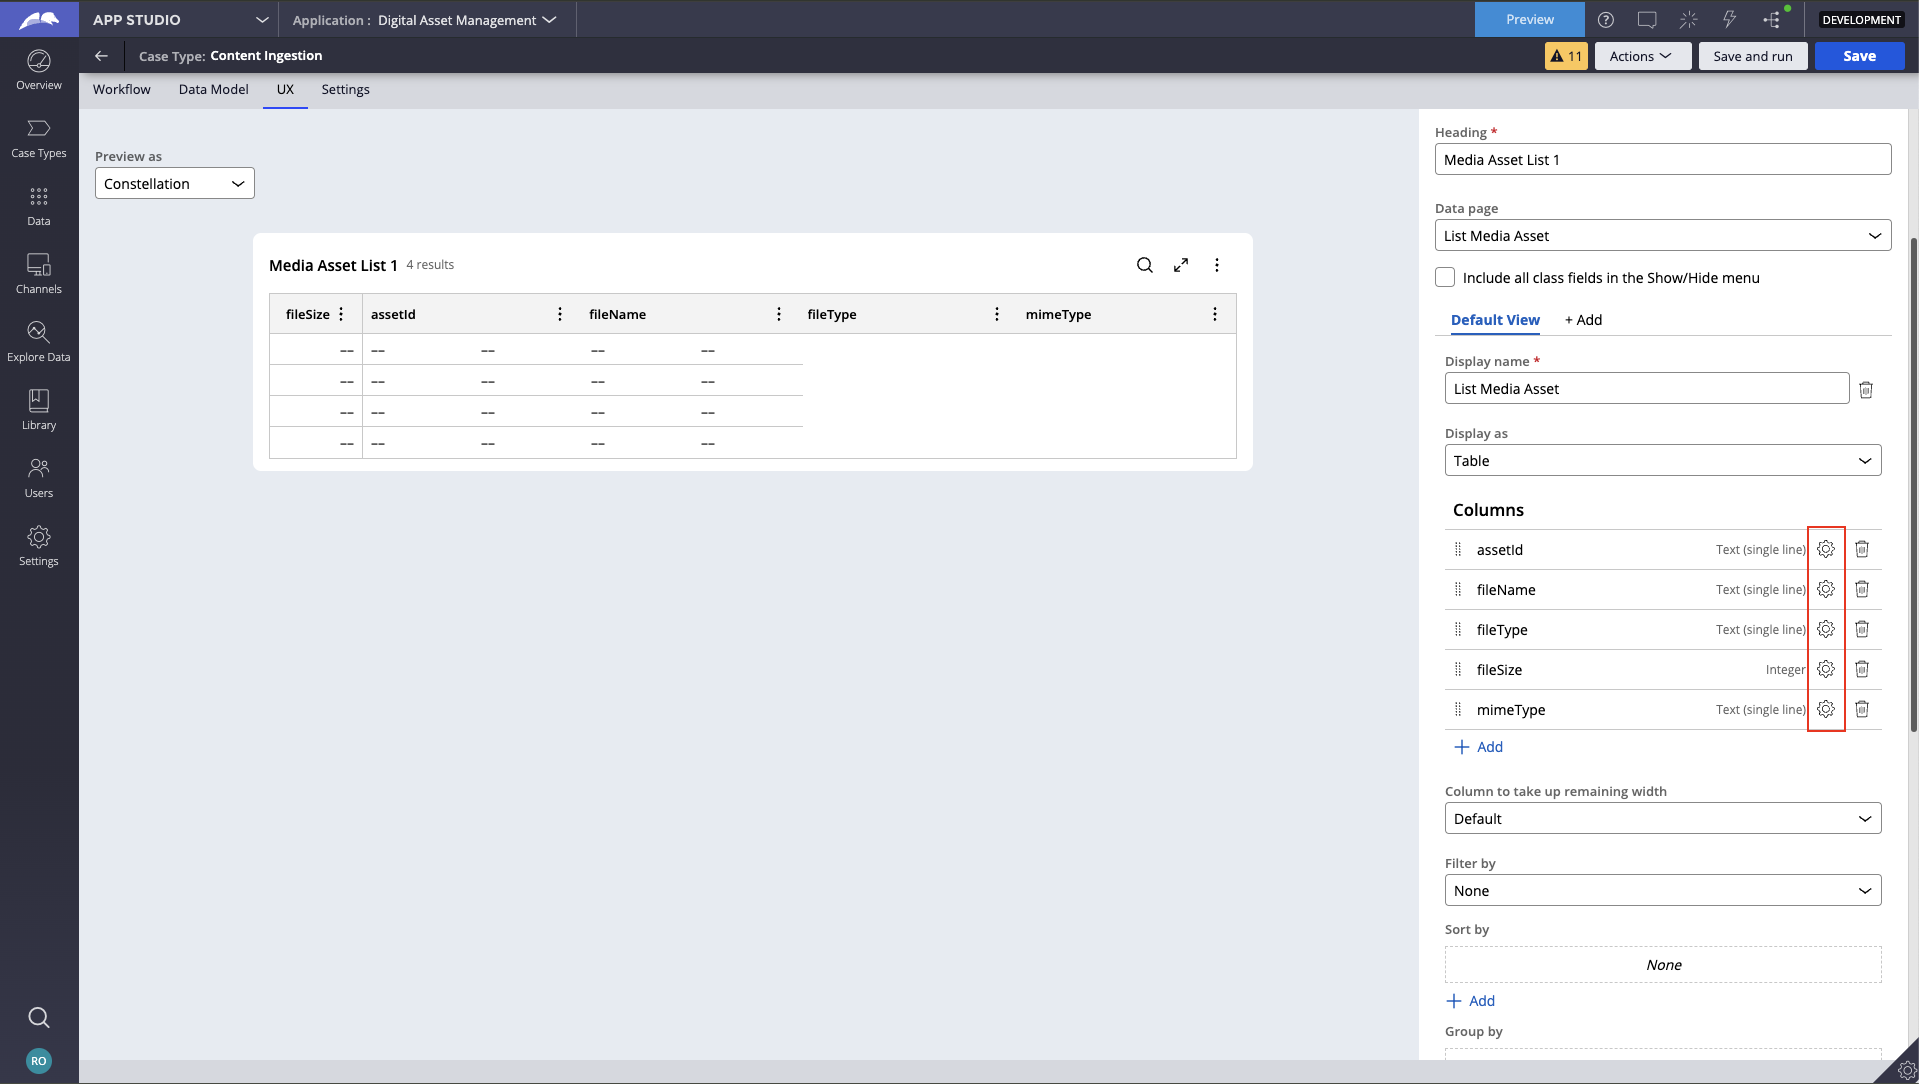
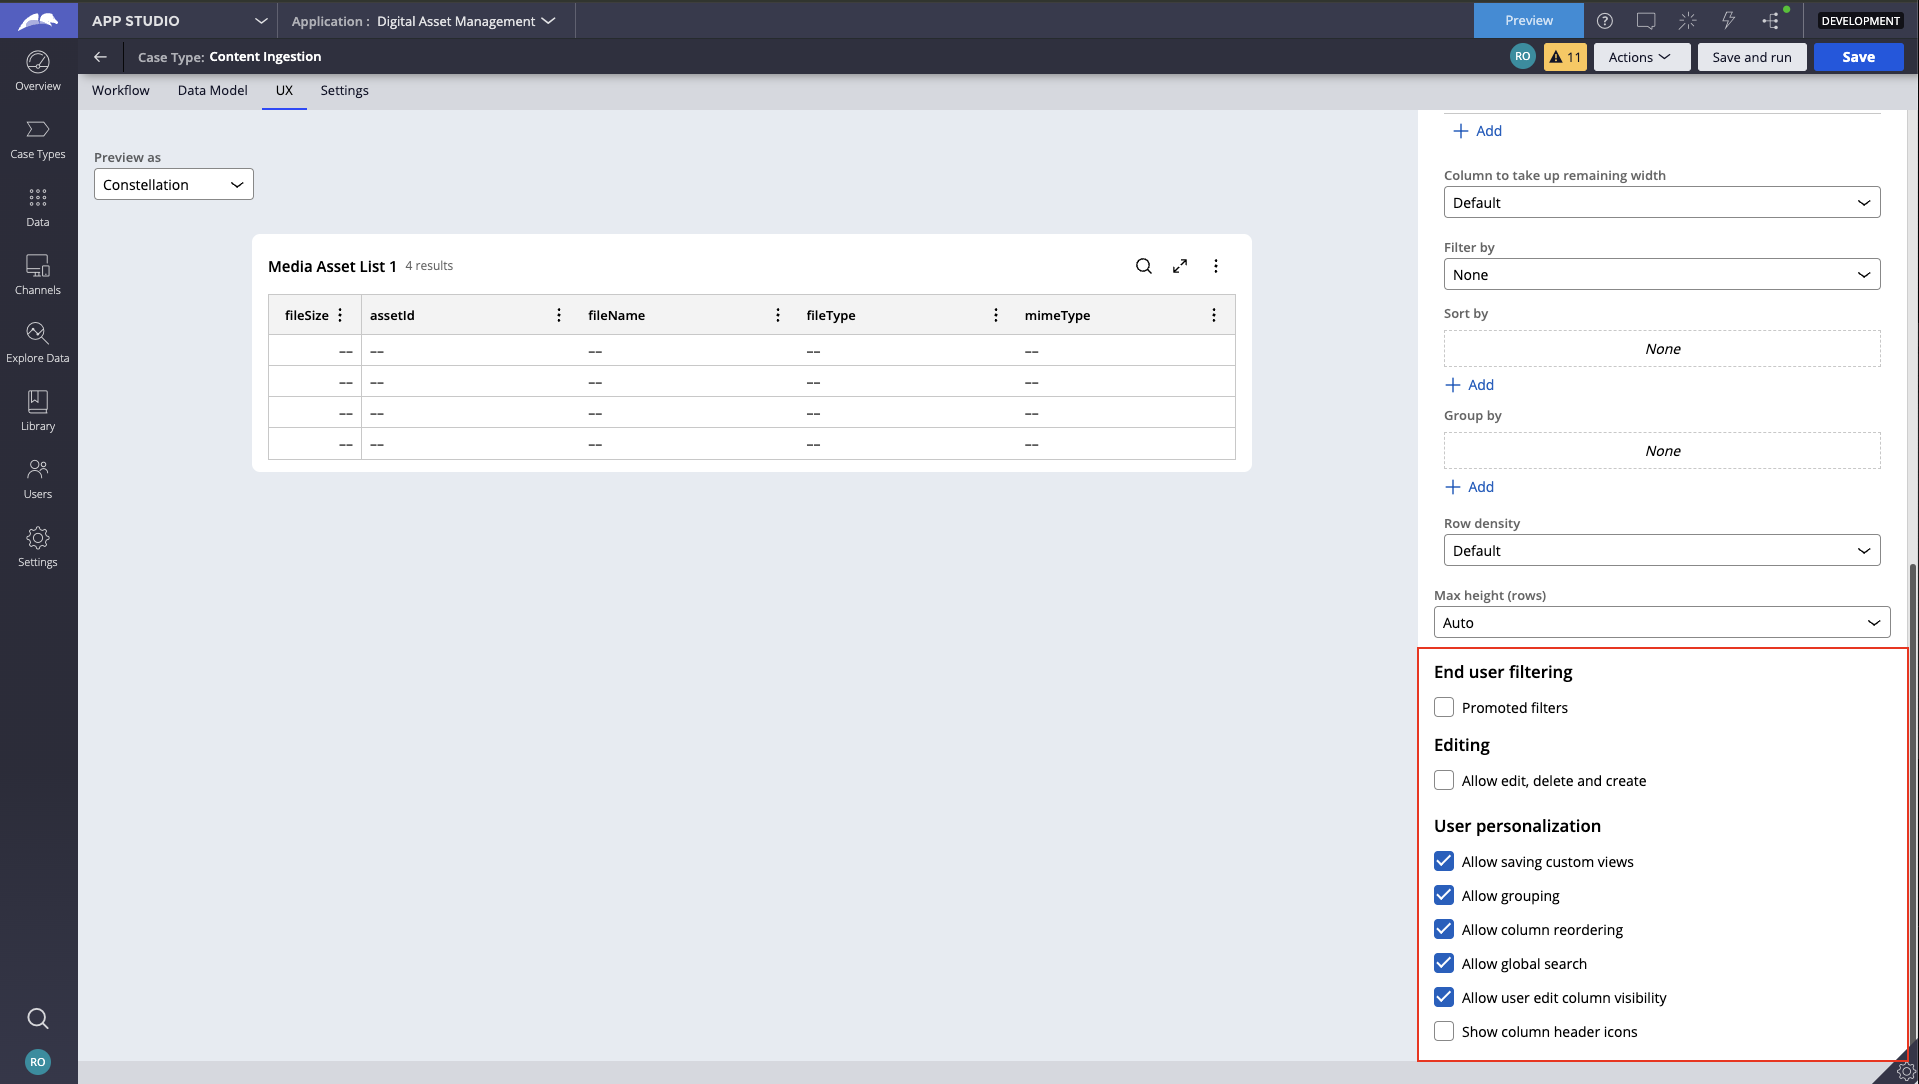
Best practices:
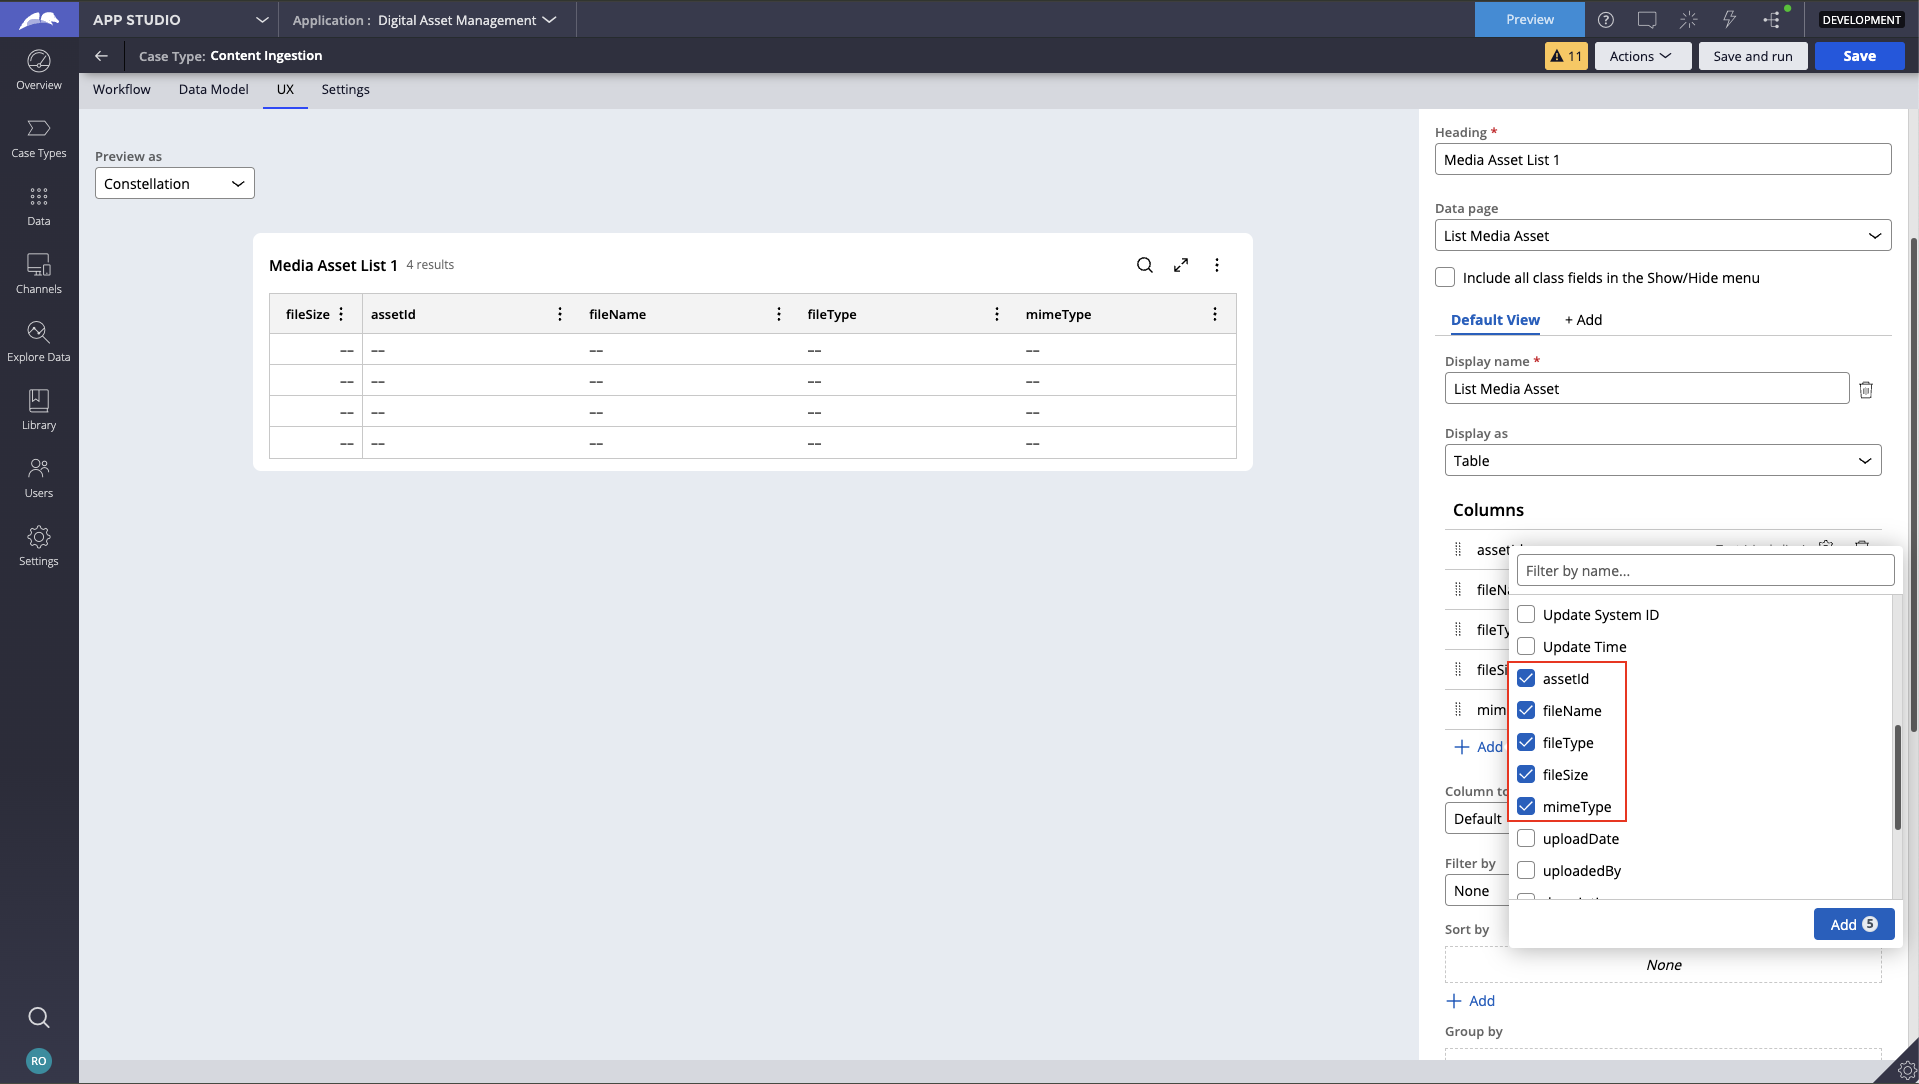
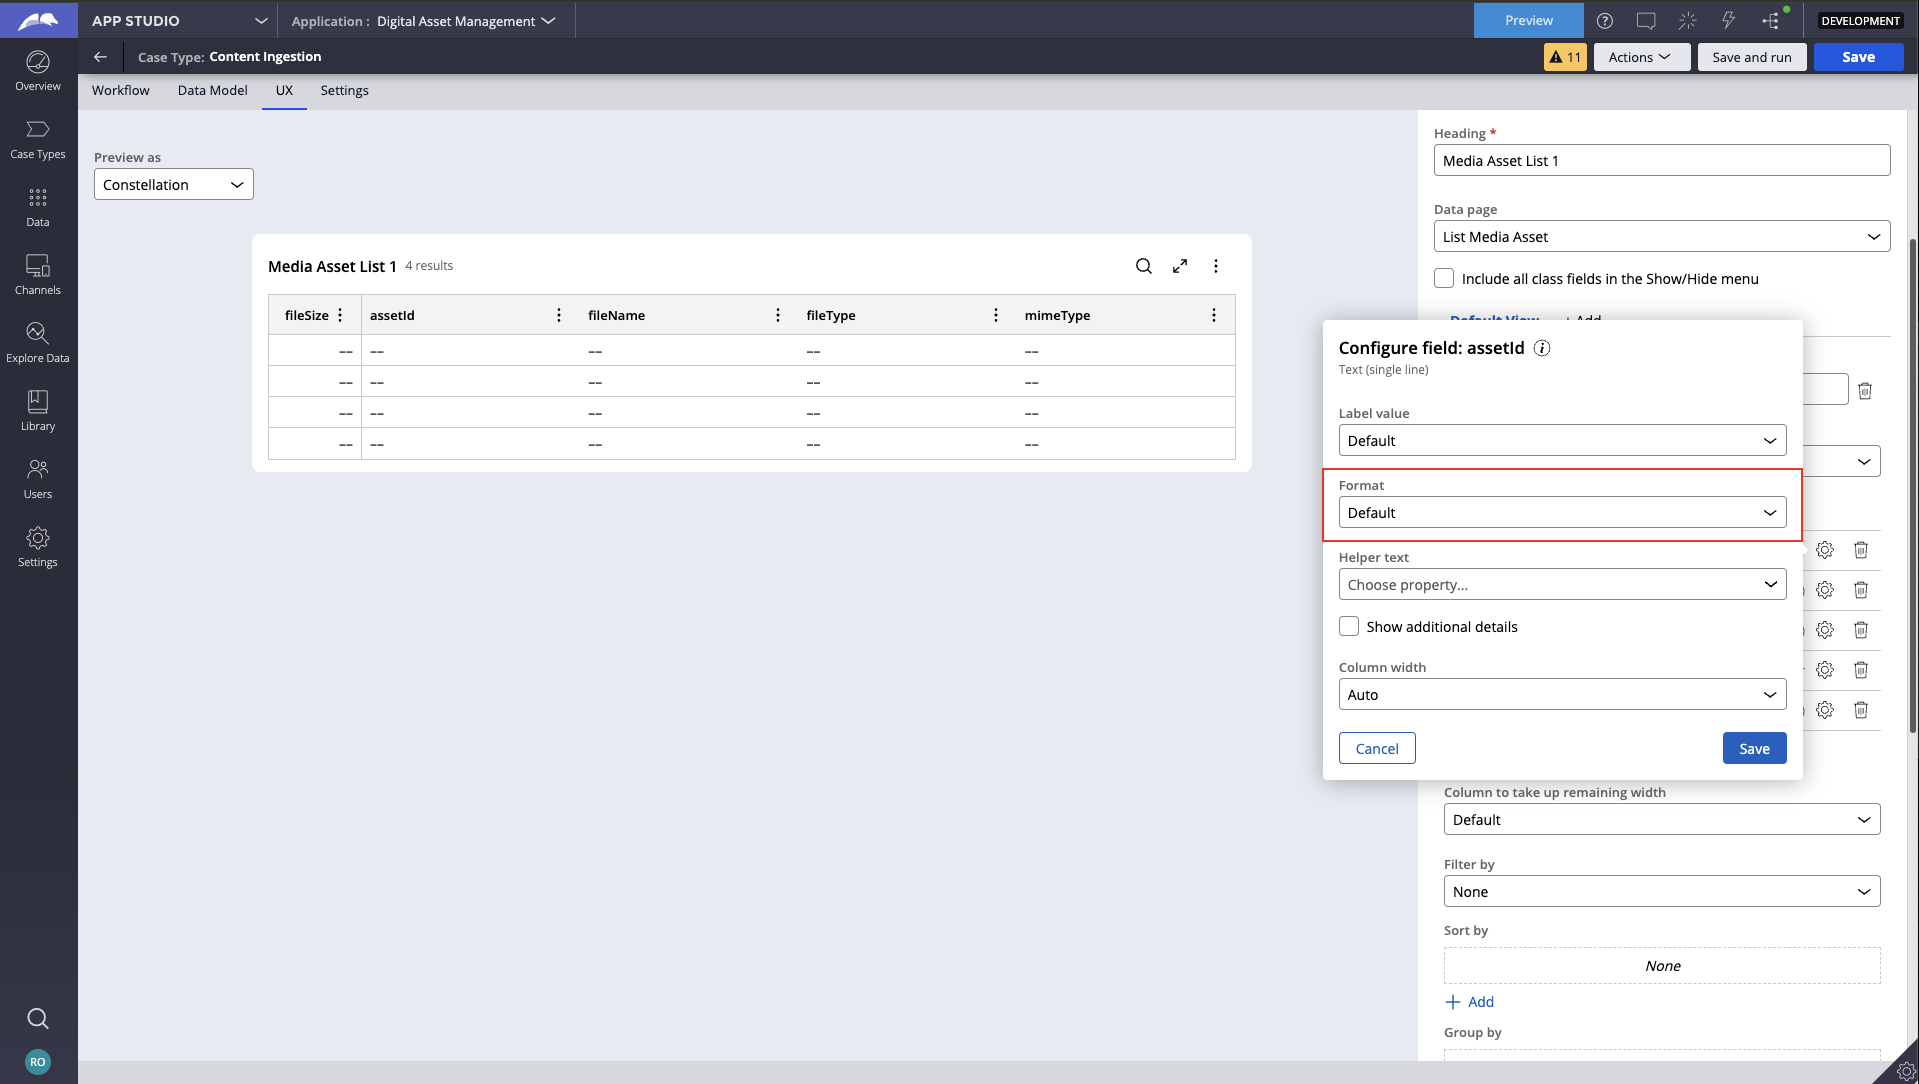
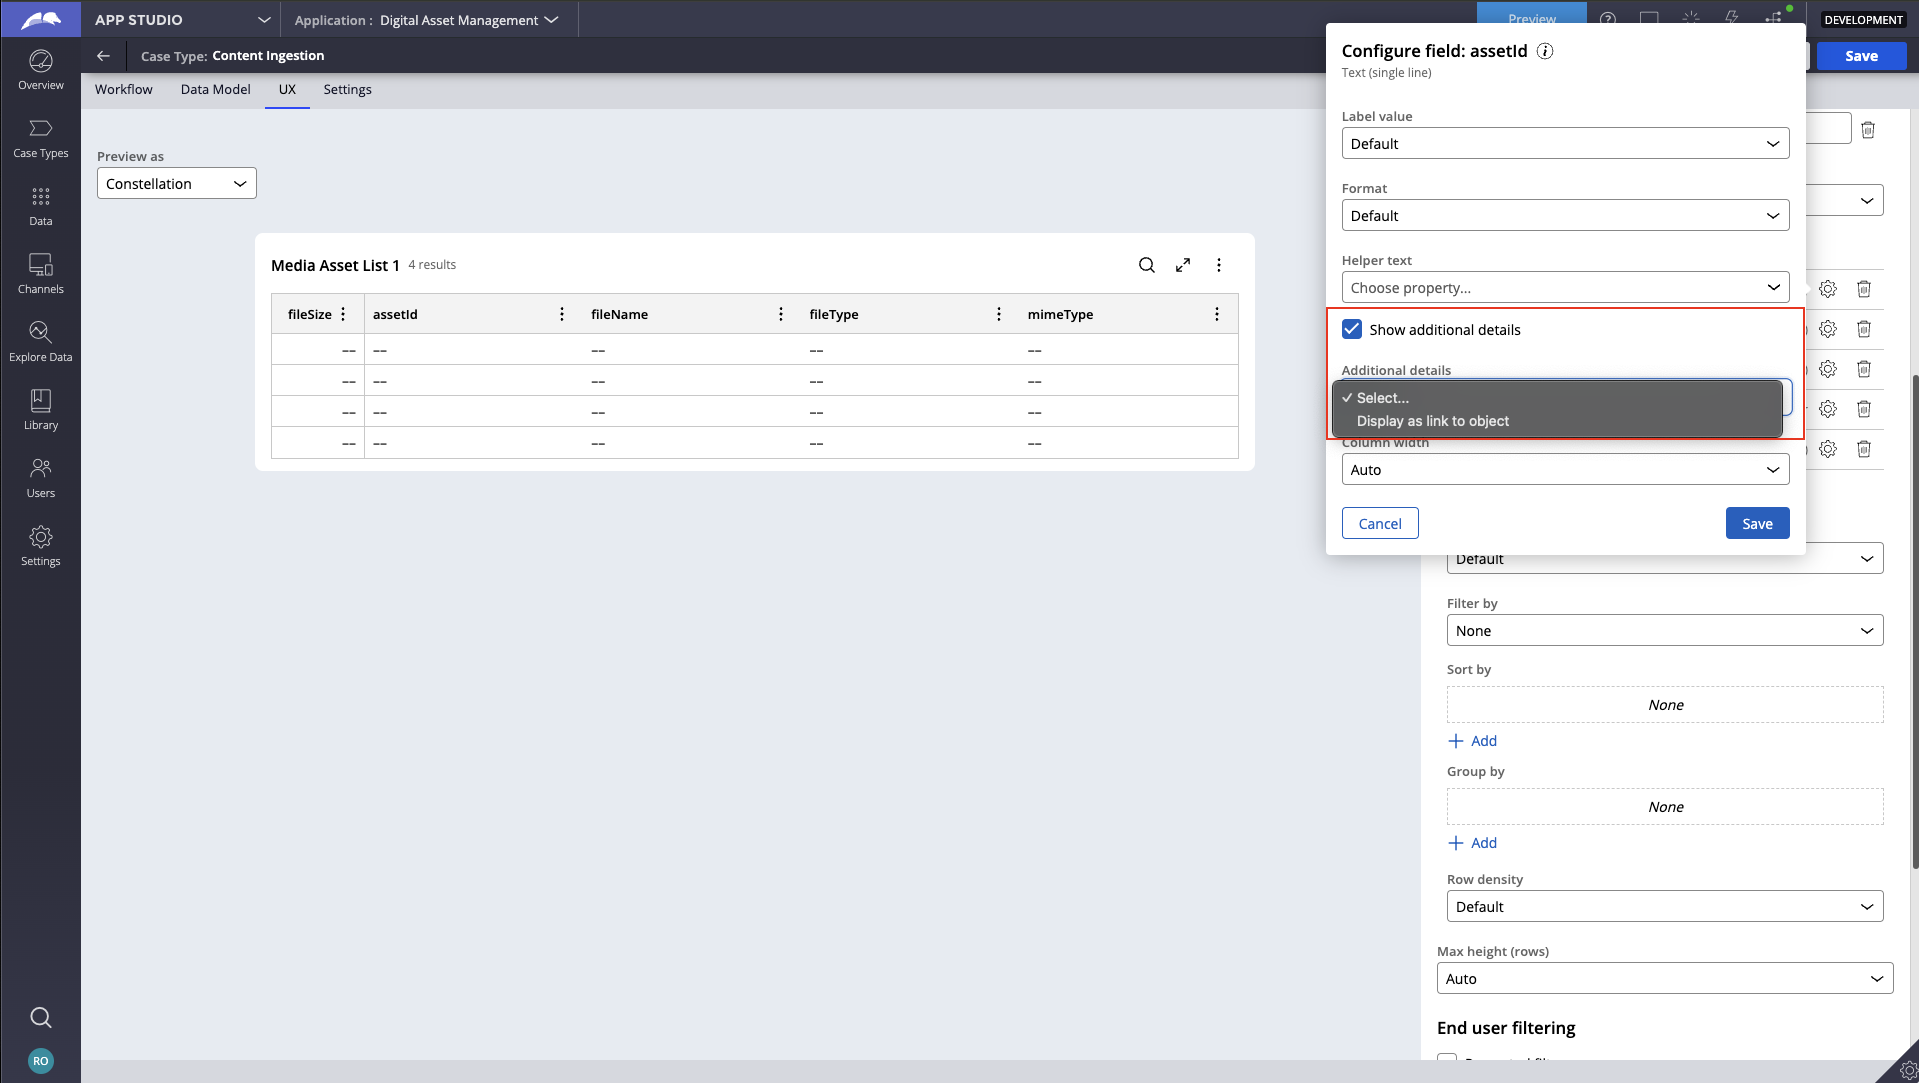
- Column Prioritization: Display the most critical fields first; hide less important ones in collapsible views or details popovers.
- Sorting and Filtering: Allow sorting by columns and dynamic filtering for ease of data analysis.
- Action Indicators: Provide menu actions within rows for quick operations (Edit, delete for List View - Optional Actions for Data Object List View).
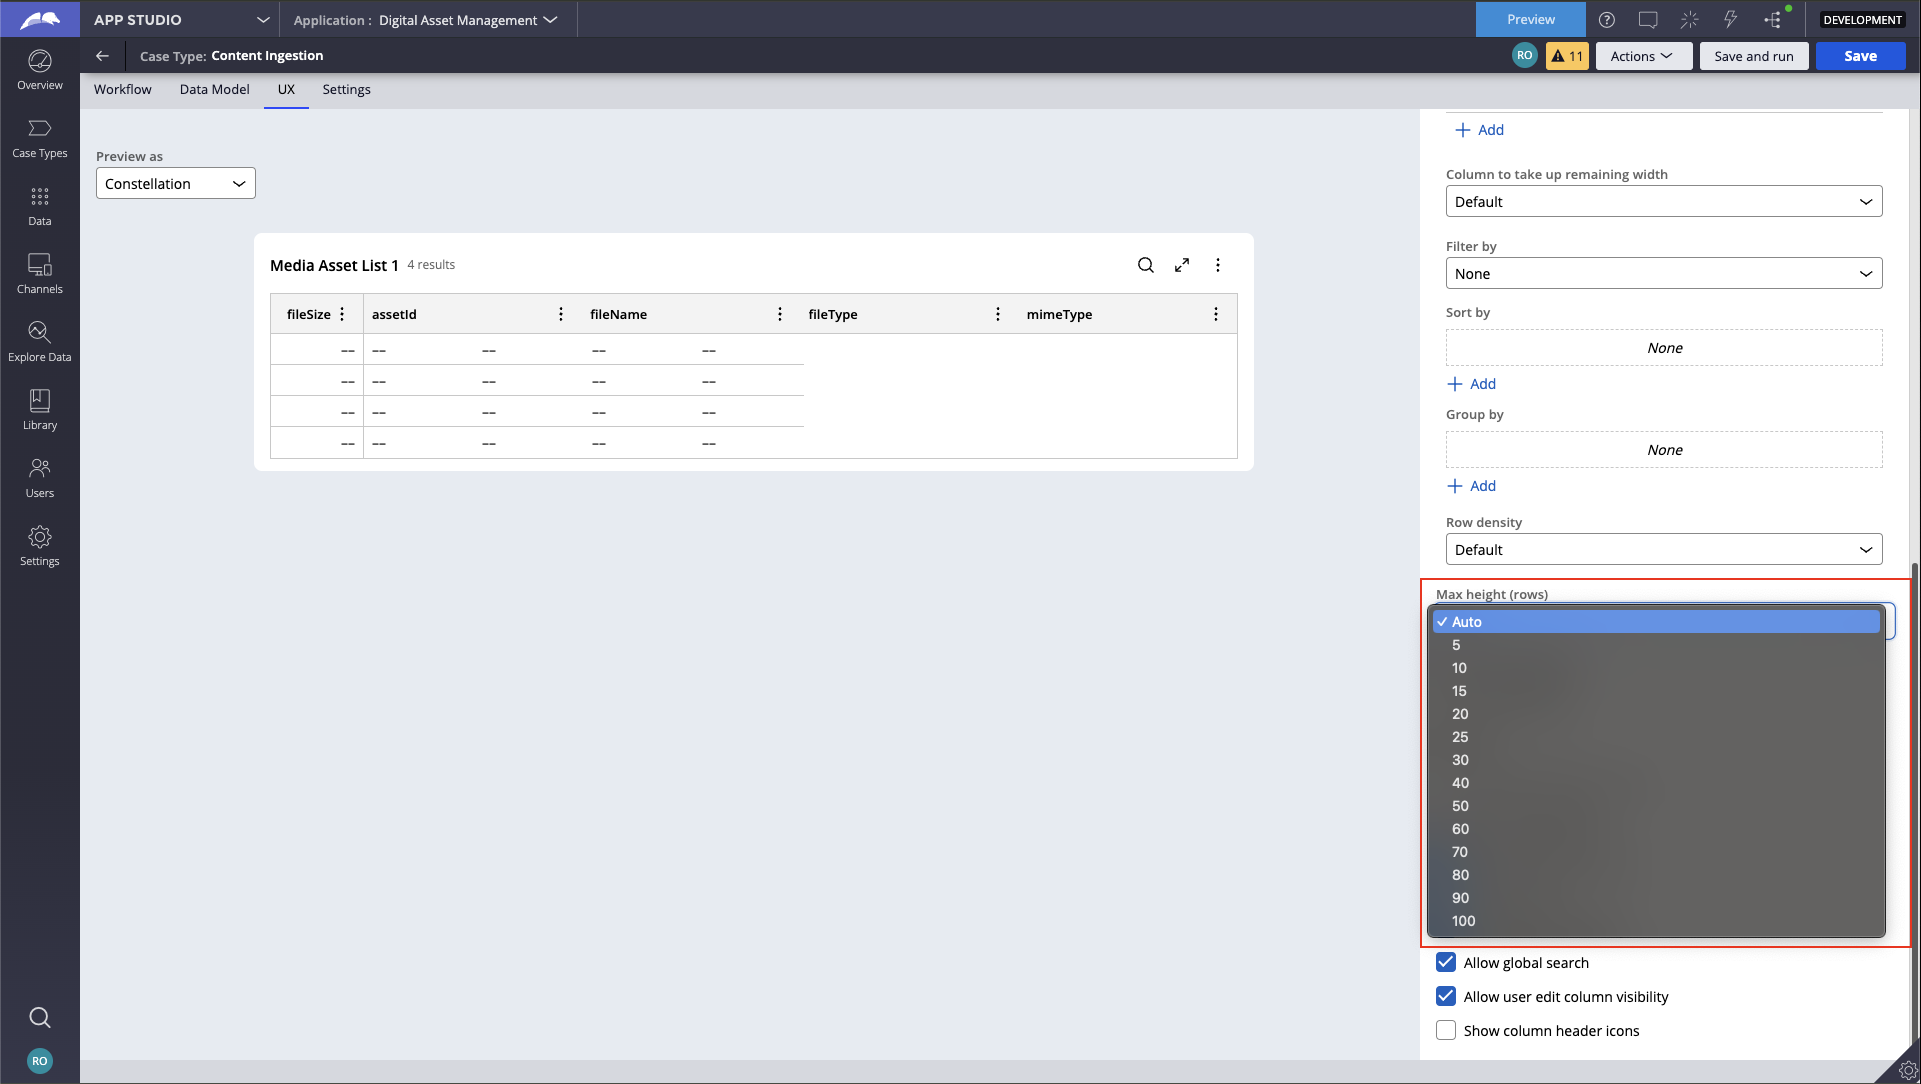
- Adjustable Columns: Allow users to resize, reorder, or hide columns based on preferences.
- Performance Optimization: For large datasets, implement lazy loading or server-side rendering.
Summary:
In summary, the Tables component in Pega Constellation provides a robust solution for managing and interacting with structured data, making it invaluable in business scenarios like customer service management, where efficient data handling and a seamless user experience are critical.
References:
Configuring List Views
Constellation 101 Series
Enjoyed this article? See more similar articles in Constellation 101 series.
Aaseya IT Services Pvt. Ltd.
IN
Hi @RichOren,
I have a scenario in my application where I need to display data records in a case as a table. In the data records, I have a property of type Integer, and based on its value I want to show a star rating instead of just the number.
I tried configuring a component for star rating and published it to my server. However, when I add the table in a view and map the integer property, there is no option to directly display it as a star rating.
Is there any other way to achieve this scenario (for example, through a custom control, DX component, or any alternative approach)?
Thanks in advance!
Pegasystems Inc.
US
@RanjithNarsiniTo use the rating star widget, update the metadata by setting the "customComponent" attribute to true for the desired column. Additionally, change the column's data type from Integer to the name of your DX Component. Please note that DX Components are considered technical debt, and refactoring may be necessary if you upgrade Infinity. This is typically required due to library updates and enhancements to the ConstellationJS API.