List Views: Grouped Rows and Table Format
Video:
Why:
Grouped rows are a powerful feature in tabular data representation. They enable users to categorize and summarize data based on specific fields or attributes, providing a hierarchical view of the data:
- Categorical Summaries: When you need to group data by specific categories or attributes and display aggregated values (e.g., totals, counts, averages) for each group.
- Example: Grouping expenses by status or orders by region.
- Data Aggregation: To display aggregated metrics for each group, such as sums, averages, or counts.
- Hierarchical Data: When the data is naturally hierarchical or categorized, making it easier to navigate (e.g., project phases, task statuses).
- Focused Analysis: To allow users to focus on one group at a time while still having access to the overall dataset.
Business use cases:
Grouped rows in a table are a useful feature for organizing and summarizing data, especially in a business context. Here are some use cases for grouped rows:
Grouped Rows Use Cases:
- Financial Reporting: Grouping rows can help in organizing financial data, such as income statements or balance sheets. For example, you could group rows by revenue streams, expense categories, or departments to provide a clearer overview of financial performance.
- Sales Analysis: In sales reports, you can group data by sales representatives, regions, or product categories. This allows businesses to analyze performance metrics easily, such as total sales, average deal size, or sales growth within each group.
- Inventory Management: Grouping inventory items by categories, such as product type, supplier, or warehouse location, can help in tracking stock levels, identifying slow-moving products, and managing reordering processes more efficiently.
- Project Management: For project tracking, tasks can be grouped by phases, teams, or priority levels. This helps project managers and team members focus on specific aspects of the project, assess progress, and allocate resources effectively.
- Customer Segmentation: Businesses can group customer data by segments such as demographics, purchasing behavior, or loyalty levels. This allows for targeted marketing strategies and personalized customer service.
- HR Reporting: In human resources, employee data can be grouped by department, job role, or performance level. This facilitates workforce planning, performance analysis, and identifying training needs.
- Operational Efficiency: Grouping operational data by process steps, locations, or shifts can help identify bottlenecks and improve workflow efficiency.
Benefits:
Grouped Row Table is ideal when:
- Improved Data Organization: Grouped rows help organize data logically, making it easier to navigate and understand large datasets. This structure allows users to quickly locate specific information without sifting through unrelated data.
- Enhanced Readability: By grouping related data, tables become more concise and visually appealing. This improves readability and helps stakeholders focus on the most relevant information.
- Simplified Analysis: Grouping enables easier comparison and analysis of data across different categories or segments. It allows users to quickly identify trends, patterns, and outliers within each group.
- Efficient Summarization: Grouped rows often allow for the inclusion of summary statistics, such as totals, averages, or counts, for each group. This provides a quick overview of key metrics without manually calculating them.
- Better Decision-Making: With organized and summarized data, decision-makers can gain clearer insights, leading to more informed and timely decisions. Grouped data highlights critical areas that may need attention or improvement.
- Streamlined Reporting: Grouping rows simplifies the creation of reports by structuring data in a way that aligns with business objectives. This makes it easier to generate consistent and meaningful reports for stakeholders.
- Time Savings: By reducing the complexity of data presentation, grouping rows saves time for both data analysts and decision-makers. It minimizes the effort required to interpret and extract insights from the data.
- Facilitates Collaboration: Well-organized data tables enhance communication and collaboration among team members, as everyone can easily access and understand the same structured information.
Prerequisites:
- Structured Data: Ensure your data is well-organized and structured. This means having a clear and consistent format, with each row representing a single record and each column representing a specific attribute or field.
- Relevant Data: Make sure the data you plan to group is relevant and pertinent to the analysis or report you aim to produce. Irrelevant data can clutter the table and make grouping less effective.
- Consistent Data Types: The data within the columns you plan to group should be of consistent types. For example, dates should be formatted consistently across all rows, and numerical data should not be mixed with text.
- Defined Grouping Criteria: Clearly define the criteria by which you want to group the rows. This could be based on categories like product type, geographical region, time periods, etc. Knowing what you want to group by will guide the grouping process.
- Data Cleaning: Before grouping, ensure that the data is clean, with errors and duplicates removed. This ensures that the grouped data is accurate and meaningful.
- Appropriate Software or Tools: Use software or tools that support row grouping, such as Microsoft Excel, Google Sheets, or more advanced data analysis tools like Tableau or Power BI. Ensure you are familiar with the functionality of these tools to group rows effectively.
- Purpose and Objectives: Have a clear understanding of the purpose and objectives of grouping the data. Knowing the end goal will help you determine the most effective way to organize and present the grouped data.
- Data Volume and Complexity: Consider the volume and complexity of your data. Large datasets may require more advanced tools or methods to group and analyze effectively, while smaller datasets might be manageable with basic spreadsheet functions.
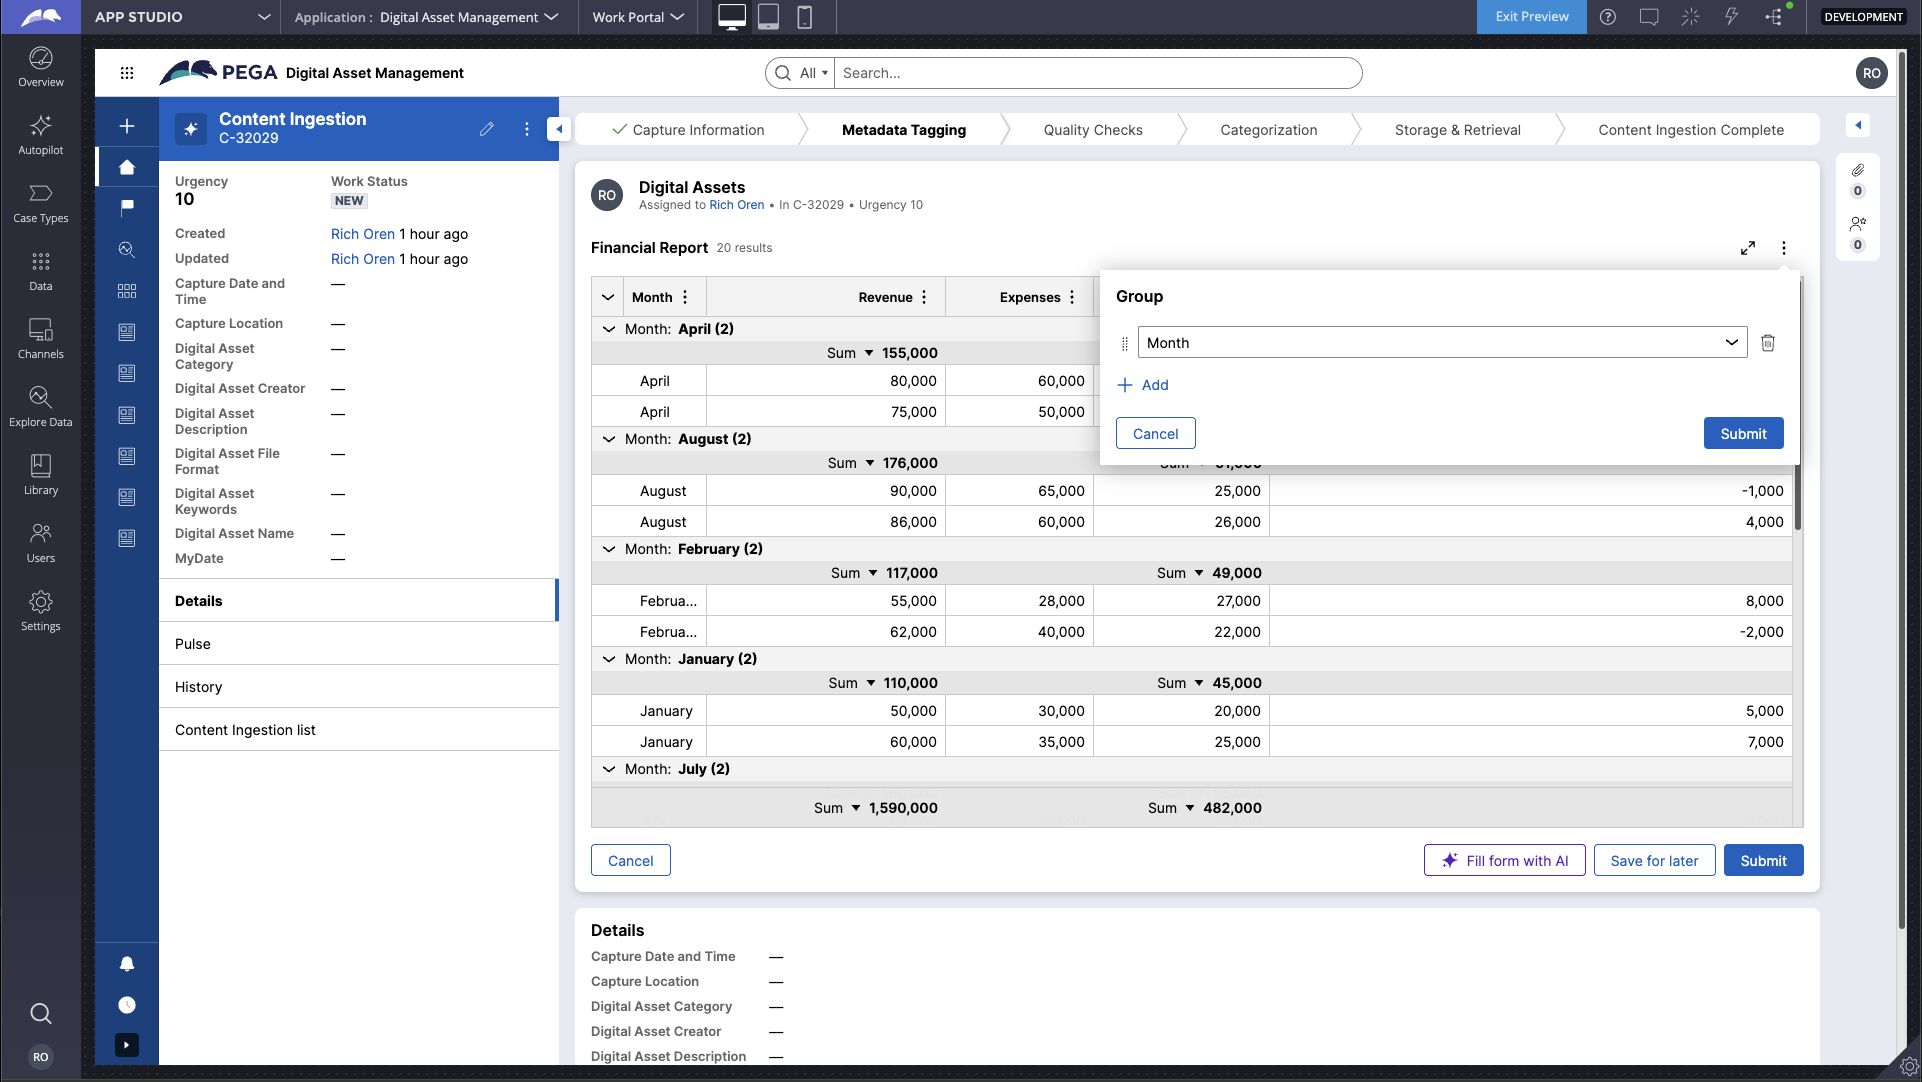
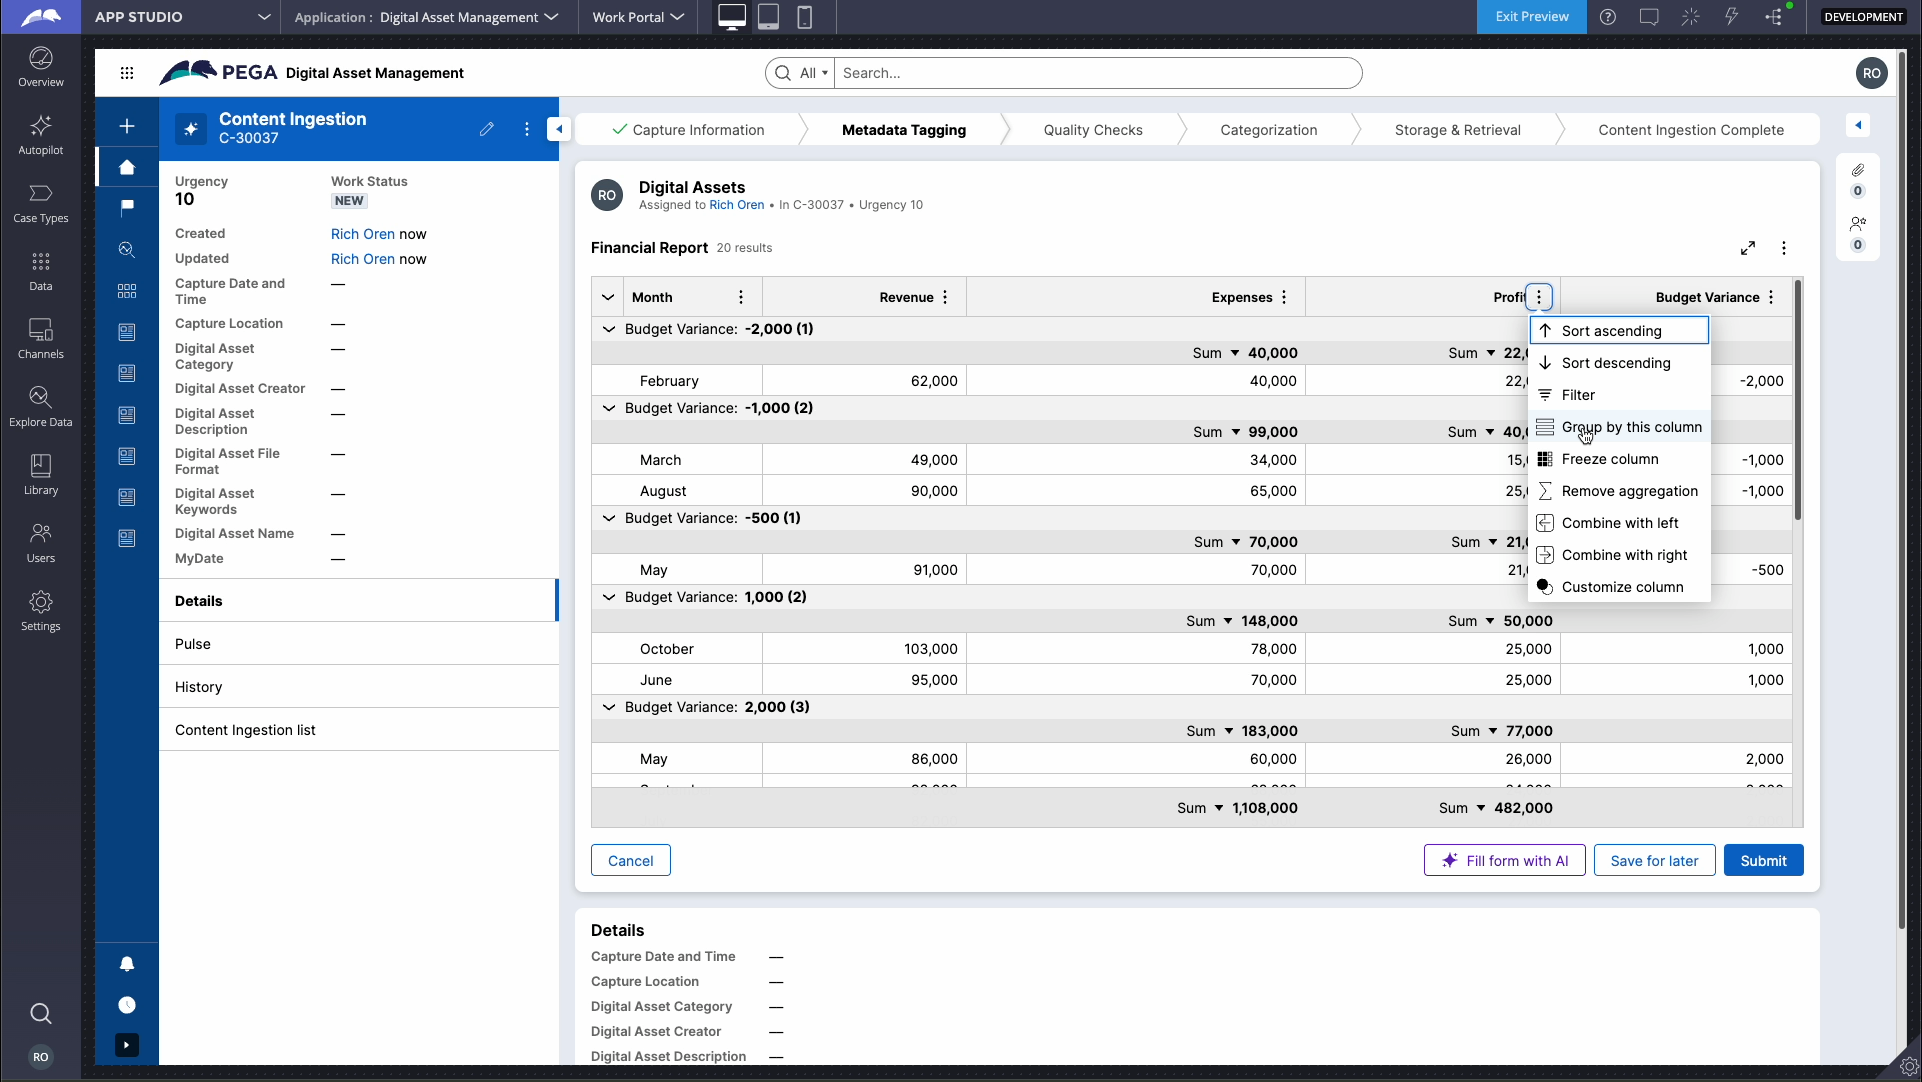
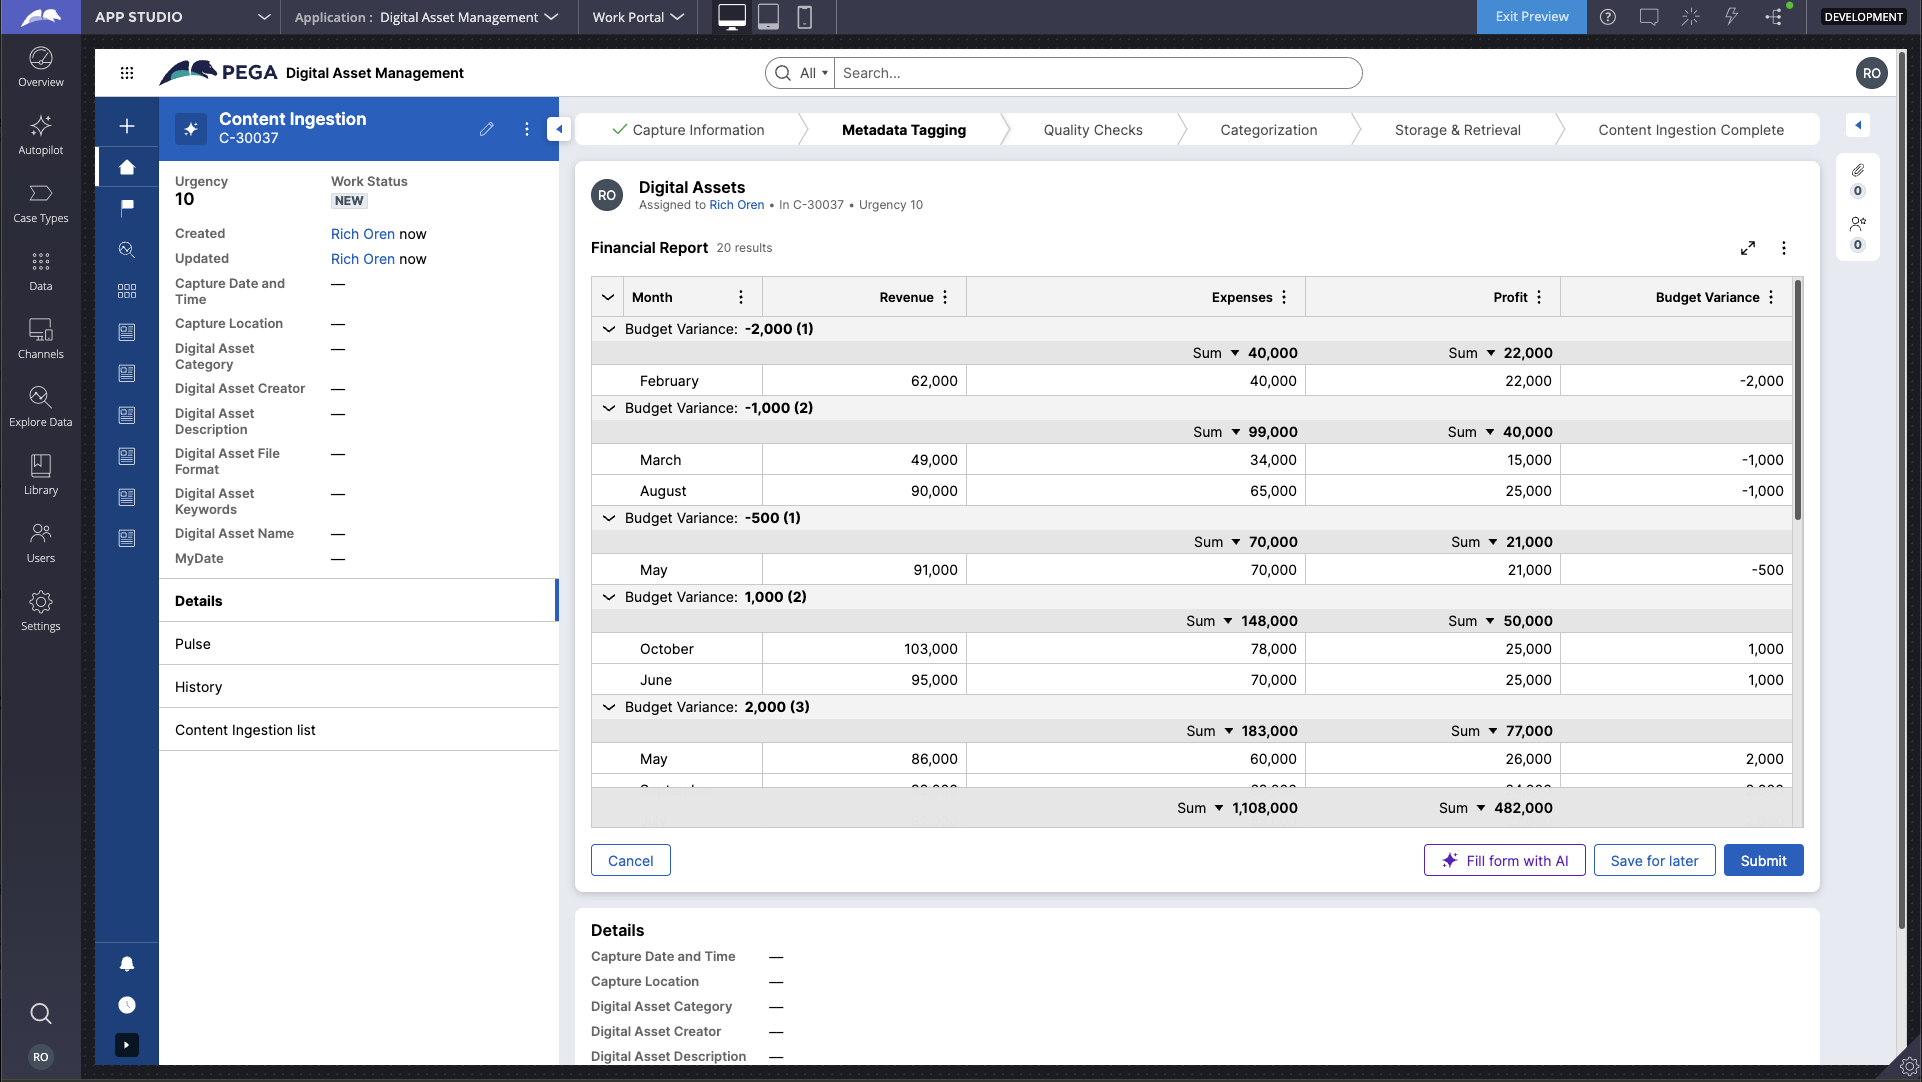
Configure Row Grouping:

Best practices:
- Meaningful Grouping: Choose attributes for grouping that are meaningful and relevant to the user's goals.
- Aggregation Display: Clearly show aggregated metrics (e.g., total amounts, counts) for each group.
- Collapsible Groups: Groups are expanded by default, users can use the collapse all icon to collapse and expand as needed..
- Sorting Within Groups: Provide sorting functionality within each group to allow users to view data in their preferred order.
- Interactive Features: Enable filtering, searching, and quick actions within and across groups for enhanced usability.
- Personalization: Grouping can be a personal preference for different users. Allow personalization to enable users to choose their own groupings or not use any grouping
Points to consider:
When to Choose What?
|
Factor |
Card Gallery |
Timeline |
Grouped Rows |
|
Primary Use Case |
Rich details with a focus on individual records. |
Time-based sequential data. |
Categorical aggregation and summaries. |
|
Data Context |
Visual representation of entities. |
Chronological relationships. |
Structured, categorized data. |
|
Aggregation |
None. |
None explicitly (may show counts). |
Summarized metrics for groups. |
|
Focus on Details |
Individual cards display rich details. |
Condensed view with expandable details. |
Within the group, sorted records. |
|
Data Volume |
Suitable for smaller datasets. |
Moderate; useful for time-sequenced data. |
Handles large datasets with hierarchy. |
Summary:
Grouped Rows approach is ideal for financial data analysis, where records (e.g., expenses) are categorized by their Work Status. The inclusion of group totals enhances usability, allowing users to assess financial summaries at a glance. This layout is particularly effective for structured, categorized data and provides clarity for managing and analyzing large datasets. If the need shifts to exploring individual records visually or chronologically, consider switching to a Card Gallery or Timeline View, respectively.
References:
Configuring Grouped Rows
Constellation 101 Series:
Enjoyed this article? See more similar articles in Constellation 101 series.
Navy Federal Credit Union
US
@RichOren This 'Group' option is only available at run-time, right? Is there way we can configure this with 'Display as Table' so the default view comes as grouped for user?