Create pie chart
You have been asked to create a pie chart that shows the number of cases each manager has
created. A list report contains columns for manager name, case ID, and office.
How do you configure the list report in order to create the pie chart?
1) Summarize the manager name column.
2) Summarize the case ID column.
I got mixed answers, please let me know the correct one. Thanks.
***Edited by Moderator Marissa to update platform capability tags****
Accepted Solution
Updated: 14 Jun 2021 7:38 EDT
.
IN
Updated: 14 Jun 2021 7:38 EDT
.
IN
The option would be 2 as when you summarize the case ID column as count, you would be getting the count of cases that each manager worked on.
RPM Technologies Inc
CA
Thanks for the quick response kanap2.
I am still not clear.... The case ID column is unique, so how can we summarize by unique column. My understanding is when we summarize by common column, it groups the items. Please explain. Thanks.
Accepted Solution
Updated: 14 Jun 2021 7:38 EDT
.
IN
Suppose there are 2 columns A and B in a report. When we summarize column A with the count, it checks for each unique value for column B, how many records are present irrespective of Column A's value.
Please find below screenshot with the sample use case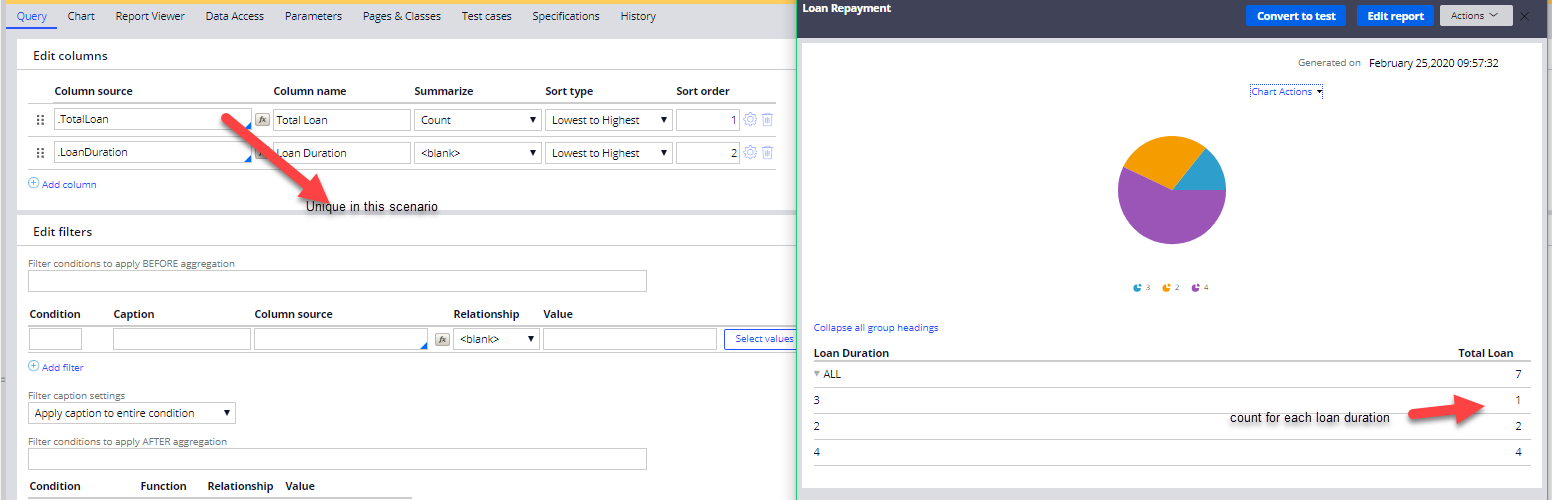
Updated: 26 Feb 2020 15:25 EST
RPM Technologies Inc
CA
Yes, I got it. Thanks!
Suppose there are 2 columns A and B in a report. When we summarize column A with the count, it checks for each unique value for column B, how many records are present irrespective of Column A's value.
Please find below screenshot with the sample use case