Closed
Solved
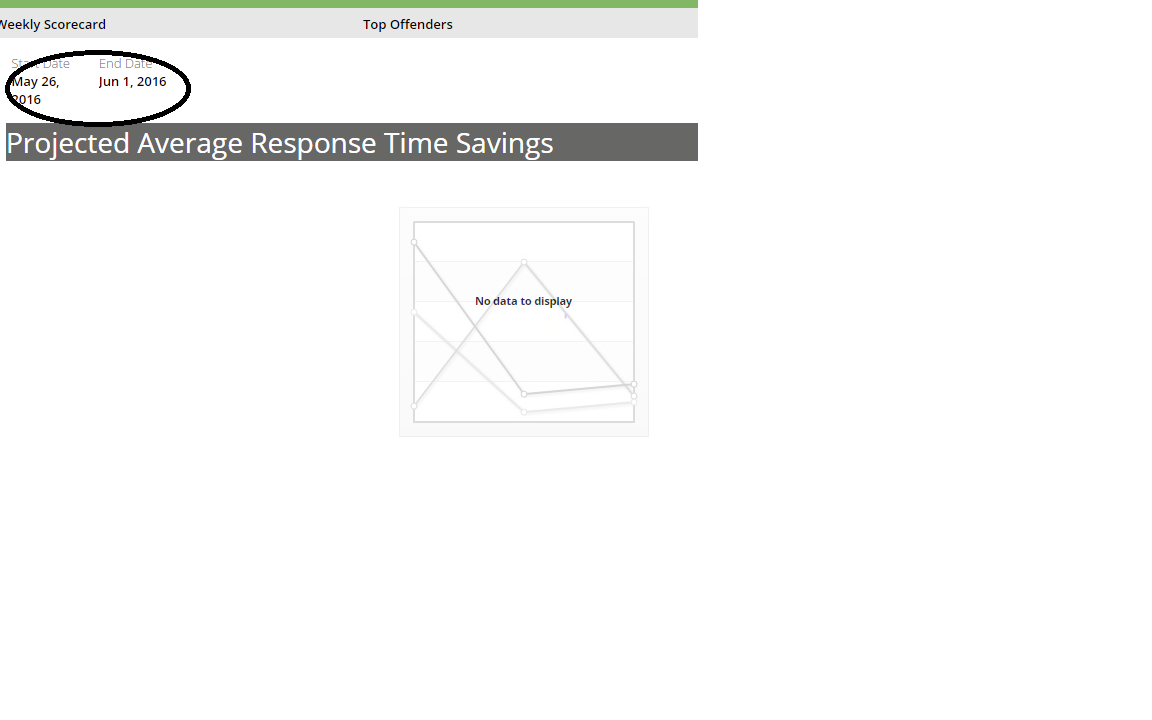
Browser Average Response Time Graph in AES
We are not getting any data on the AES Dashboard for Browser Average Response time. It gives "No data to display" where it should be displaying the graph.
When I look in the .pegaam_alert where PYLABEL='Browser Time' it has the data from monitored nodes. Any idea what could be wrong here?


