Applies to Pega Platform versions 7.2 through 8.5
This document is one in the series on Troubleshooting HTTP and web server issues.
Understand what HTTP requests and responses are, how they behave, status codes that indicate failure, and basic techniques for isolating the root cause of an HTTP request or response failure.
HTTP response status codes indicate whether a specific HTTP request has been successfully completed. When an HTTP request does not complete successfully isolating the root cause of the failure can be challenging. For example, the cause of the failed request might be that Symantec SiteMinder is blocking the request or that the access group contains special characters.
FAQs: Debugging and troubleshooting errors
HTTP status code examples for common problems
Prerequisites
Before you begin root cause analysis of HTTP request issues, you need the following prerequisites:
Tools for debugging HTTP request issues
Required deployment artifacts from the target system
Tools for debugging HTTP request issues
To capture, inspect, monitor, and replay both HTTP and HTTPS network traffic from any browser and any application have ready and know how to use common network tracing tools:
- Telerik Fiddler
- Chrome DevTools, the Network tool, if Fiddler is not available
- Other browsers’ developer tools, the Network tool, if Fiddler is not available
To enable the Pega-provided Debug loggers, use the Dev Studio and specify the logger settings.
Required deployment artifacts from the target system
Collect the following deployment artifacts from the system experiencing the issue:
- Deployment topology, which identifies the different layers involved in serving a request, for example:
- Load balancers
- Proxies
- Security layers such as Symantec SiteMinder or other web access management tool
- Application server, including its version
- Web server, including its versions
- PegaRules log file
- Application server and Web server logs, for example
- catalina.out (Apache Tomcat)
- SystemOut.log (IBM WebSphere Application Server)
- SystemErr.log (IBM WebSphere Application Server)
- Network trace results from Fiddler or Chrome DevTools
FAQs: HTTP basics
Answers to frequently asked questions about common problems will help you troubleshoot HTTP request issues.
What is the meaning of different HTTP status codes?
How can I tell which server is returning the response?
What do I need to check in the HTTP request and response?
Which loggers do I need to enable?
What are HTTP status codes?
HTTP response status codes indicate whether the requests are successful. If an HTTP request does not successfully complete, the status code helps in isolating the root cause of the problem.
What is the meaning of different HTTP status codes?
HTTP status codes are grouped into five categories and defined in the Wikipedia entry, List of HTTP status codes.
How can I tell which server is returning the response?
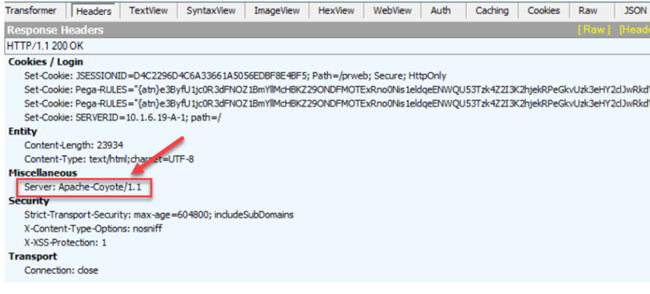
Using Fiddler or your browser’s developer tools for network tracing, view the HTTP Response Headers.
In the HTTP Response Headers, the Miscellaneous section, find the Server header as shown in the following example:
What do I need to check in the HTTP request and response?
To isolate the cause of a problematic request or to compare the difference between a successful and an unsuccessful request, check the following elements:
- request header
- response header
- query string
- post data
If any of these elements are different, then debug to determine why the discrepancy exists.
Examples of discrepancies
If a request header does not contain a PegaRULES cookie for requests, then debug why there is no PegaRULES cookie.
If the required query string is missing, determine how it is omitted. Was the request formed incorrectly from UI?
Which loggers do I need to enable?
Enable the following loggers by copying and pasting the logger names into the prlog4j2.xml file:
- LogHttpRequest
- com.pega.pegarules.session.internal.engineinterface.service.HttpAPI
For more information, see Configuring logger settings.
Enable the logger depending on the HTTP status code from the following list of loggers:
HTTPStatusCode303
HTTPStatusCode304
HTTPStatusCode400
HTTPStatusCode404
HTTPStatusCode500
HTTPStatusCode401
What is deployment topology?
The Pega deployment topology comprises tiers of infrastructure elements, for example:
- Operating system
- Application server
- Database
- Browsers
- Load balancers
- Reverse proxies
- Java versions
- Other infrastructure elements not listed here but identified in Pega Platform Support Guide Resources.
FAQs: Debugging and troubleshooting errors
The following answers to frequently asked questions about debugging problematic HTTP requests and responses can guide your troubleshooting effort.
If a Pega-RULES cookie is not sent in a request can anything go wrong?
When is the Set-Cookie response header not in a response?
What attributes should be specified in the Set-Cookie response header?
What is the 'secure' attribute and how is it used?
What is the 'HttpOnly' attribute in the Set-Cookie header and how is it used?
I see status code 500: What additional artifacts do I need to collect? I see status codes indicating a problem, but I do not see any error in the PegaRules log file. Why?
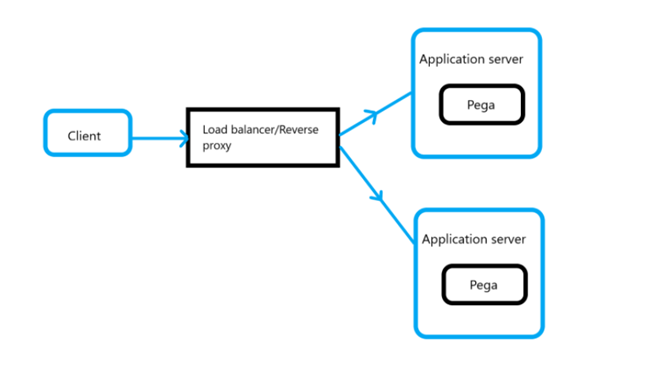
Because an HTTP request goes through several layers of Pega deployment topology, you need to isolate which layer is responsible for the root cause of the problem. As shown in this simple diagram, the HTTP request is processed from the client-side operating system and browser to communication intermediaries like load balancers and reverse proxies before arriving at the application server on which the Pega instance runs. Depending on how clustered your Pega deployment is, the challenge of isolating where in the topology layers the HTTP problem exists requires methodical analysis and perseverance.
- Ping the IP address of the node.
- If you cannot reproduce the problem, then the cause is likely with either the load balancer or the reverse proxy. Check the load balancer or the reverse proxy configuration.
- If the issue is still not reproducible after performing Steps 1 and 2, check the application server logs.
- In addition to pinging the node IP address directly, check the HTTP and HTTPs URLs using cURL.
- If you suspect that the issue might be related to SSL or TLS protocols only, check the SSL and TLS settings.
- If there are no exceptions or errors in the application server logs, try reproducing the issue with basic authentication in case the issue stems from custom authentication or an expired authentication IDP certificate.
- Enable loggers corresponding to the status code, for example, HttpAPI logger for HTTPStatusCode303.
- After enabling the loggers, record the network trace for both the reproducible and non-reproducible scenarios.
If a Pega-RULES cookie is not sent in a request can anything go wrong?
Yes. With cross-origin resource sharing (CORS) and Pega Web Mashups, the SameSite cookie set to the value "lax" in Chrome causes subsequent requests to not have the cookie. You must set the SameSite cookie to "none". See CORB error with Chrome 80 SameSite cookies.
When is the Set-Cookie response header not in a response?
The Set-Cookie response header is not in an HTTP response when the following conditions exist:
- When the request is a static content request
- When the status code 303 (a temporary redirect) is thrown because of a missing application alias in the URL
- When the error comes from the deployment topology layers other than Pega, for example, the application server, Identity Provider (IDP), and other layers.
What attributes should be specified in the Set-Cookie response header?
In the Set-Cookie response header, specify the following attributes:
- cookie name
- cookie value
- cookie path
- secure and httpOnly attributes (optional)
What is the 'secure' attribute and how is it used?
If the prconfig.xml setting "http/setsecurecookie" is set to true, a secure attribute is added to response cookies. If a secure attribute is set in a cookie, then it can be sent only over HTTPS. Response cookies with the secure attribute set will not work over HTTP. See Understanding dynamic system settings.
What is the 'HttpOnly' attribute in the Set-Cookie header and how is it used?
If the prconfig.xml setting cookie/HttpOnly is set to true, the HttpOnly attribute is added to the response cookies, causing cookies to be part of headers.
A cookie with the HttpOnly attribute is inaccessible to the JavaScript Document.cookie API; it is sent only to the server. For example, cookies that persist server-side sessions do not need to be available to JavaScript and should have the HttpOnly attribute. This precaution helps mitigate cross-site scripting (XSS) attacks because cookies with the HttpOnly attribute cannot be accessed from client-side security.
HTTP status code examples for common problems
There are five categories of HTTPS status codes. HTTP request problems commonly reported for Pega deployments usually pertain to the following status codes.
303 See Other
303 See Other is a way to is a way to redirect web applications to a new URI, particularly after a HTTP POST has been performed. It continuously redirects, not allowing users to perform any action.
When you see HTTP status code 303, ask the following questions and check the appropriate settings and loggers:
- Is it happening only with custom authentication?
- Is it reproducible even with basic authentication?
- Are the cookies correctly set in each request?
Before authentication, there is a pre-ATN cookie in the request and post authentication. The URL is redirected to the correct URL with the AccessGroup hash corresponding to the operator's default accessgroup, and the response cookie is either requestorid (for older versions) or encrypted pegaRULES cookie. This flow must be checked.
Enable HttpAPI and HTTPStatusCode303 loggers.
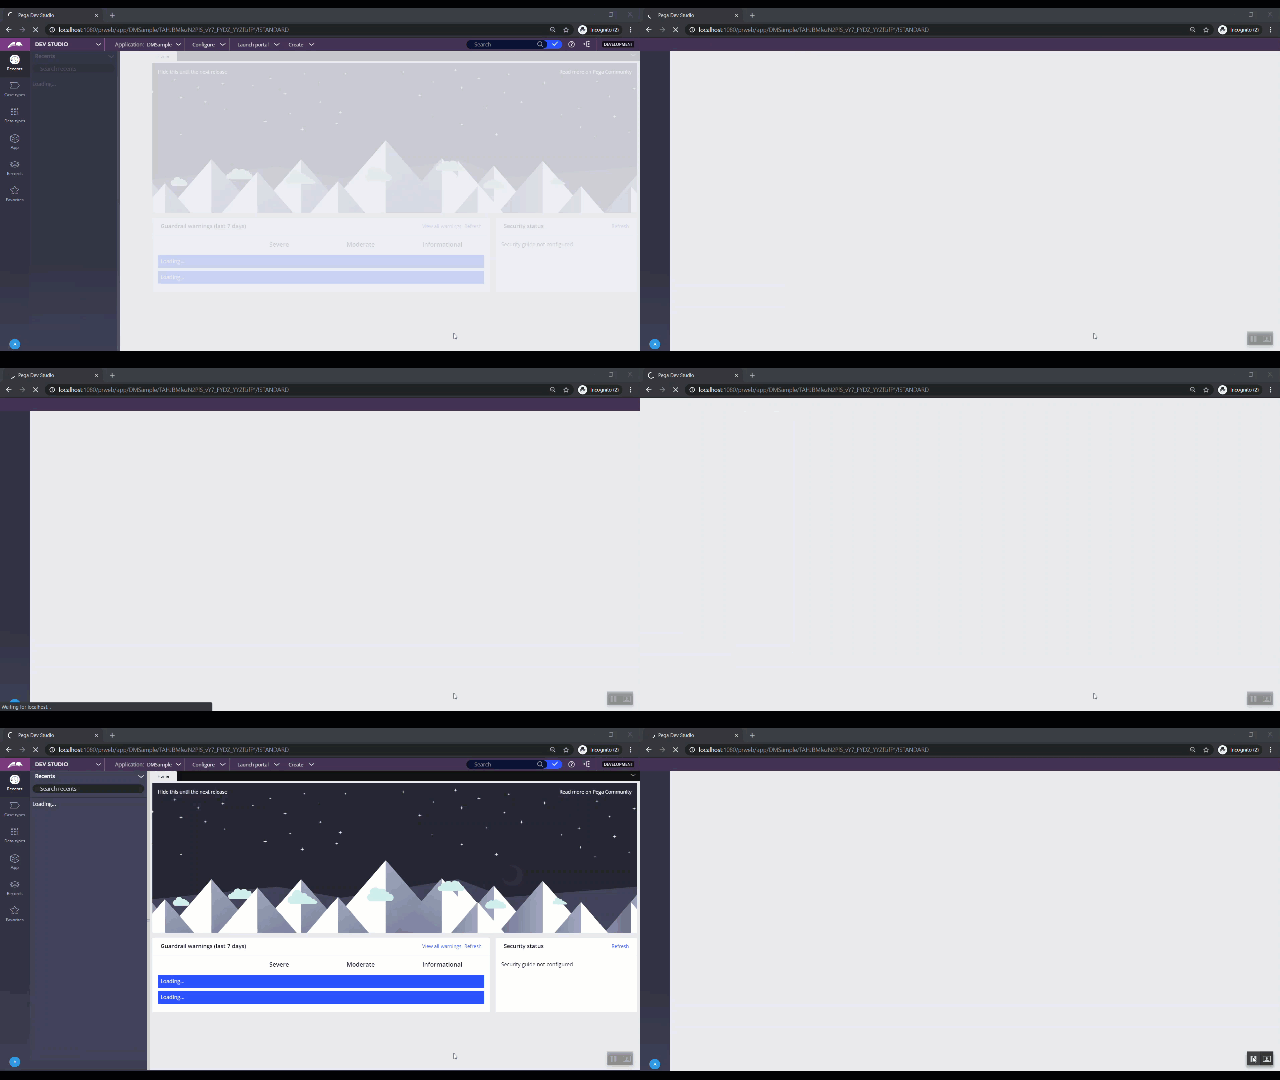
If the continuous redirects displays as an infinite flickering of the screen, this might be caused by the incorrect cookie set after a node crash or after the requestor is destroyed. Confirm this situation. Pega 7.3.1 HFix-59225 and Pega 8.1.3 HFix-6298 correct this defect. You can avoid this issue by upgrading to the latest Pega Platform patch release. See Keeping current with Pega.
The following animated figure illustrates the infinite loop caused by continuous redirects of the HTTP request.
304 Not Modified
When static content is requested, two situations can cause the 304 status code.
- Static content images in Logout response
When a Logout response contains static content images, those images are not loaded because the requestor is destroyed after users log off the system. When this situation occurs, Pega returns a 304 status code.
- Cache-Control header contains the no-cache value
When the load balancer sets the no-cache value in the Cache-Control header for static content requests, the 304 status is thrown and the application’s user interface is distorted.
400 Bad Request
Two situations can cause the 400 status code:
- Square brackets ([[) in the AccessGroup hash of the URL
Because the square bracket character ([) is not URL-safe, the application server might stop the request, throwing code 400. If this happens, determine whether the 400 code is coming from the application server, the load balancer, or third-party identity providers (IDPs) like Symantec SiteMinder.
When you have isolated the source of the 400 code, change its configuration to remove the square bracket characters ([[). The square bracket ([) is a padding character added by Pega in platform releases prior to Pega 8.5. Beginning with Pega 8.5, padding characters are no longer added to the AccessGroup hash.
- Authentication failure
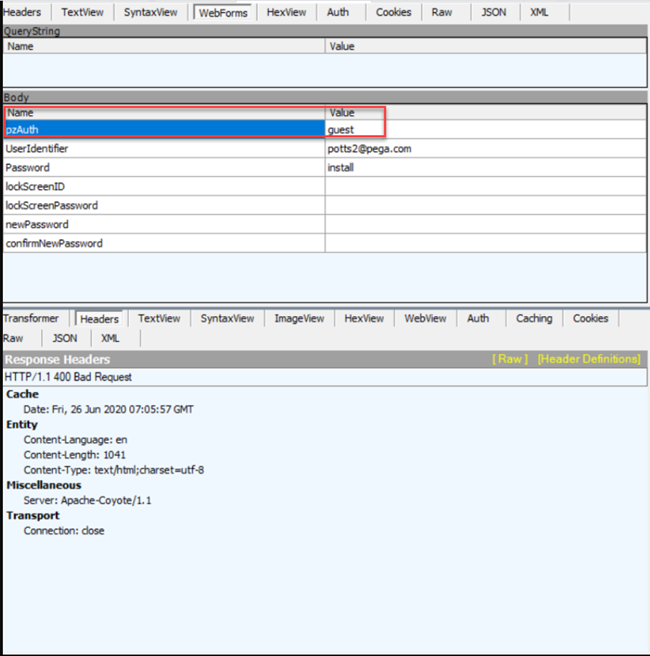
When there is no login activity sent as a parameter in an HTTP POST request for login, the request is interpreted as a snapstart. The status code 400 is thrown because a snapstart URL expects authentication credentials (a userID and password) in query parameters. In the following figure, the HTTP Request, WebForms shows parameter pzAuth with the value guest.
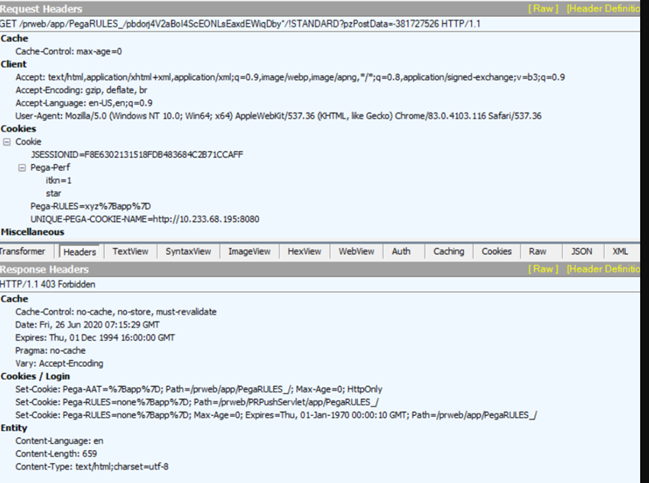
403 Forbidden
Two situations can cause the 403 status code:
- Cookie decryption failure during upgrade
During Pega platform upgrade, if users keep the same browser session open, the 403 code is thrown because of cookie decryption failure. This temporary issue goes away on refresh of the browser, which allows the login screen to display. This temporary glitch in the user experience during upgrade causes no major functional problem. In releases prior to Pega 8.3, users must clear their cookies to display the Pega login screen.
- Hack attempt injects invalid cookie
If a hacker tries to inject some invalid cookie, the 403 code is thrown, forbidding the user to proceed. The HTTP request is stopped and does not complete.
The following figures illustrate both scenarios:

500 Internal Server Error
Three common situations can cause the 500 status code:
- Security violation exception, com.pega.pegarules.pub.context.PRSecurityExceptionSecurity violation attempting to access requestor
This exception is generally thrown when there is a pre-authentication cookie in the request, but the user is already authenticated. This usually happens when automated tests are incorrectly configured. If the test is an automated load test, check the scripts to determine if there are any stale cookies sent when the HTTP request is fired.
- User authentication failure caused by mismatch with application alias
Beginning with Pega 8.4, if a user does not have access to the application corresponding to the application alias specified in the URL, then the user sees the 500 code when trying to authenticate into the application.
- Change to Pega-provided default logoff
Logoff is a two-step process: The first step un-authenticates the requestor session, sending back the pre-authentication cookie, and the second step destroys the requestor session. Sometimes, as a Pega application developer, you might design logoff in a browser tab Close or a harness Unload. These design choices result in incomplete processing. Consequently, users who try to address the Pega URL the next time in the same browser session experience issues because invalid cookies are sent in the HTTP request. Users see the on-screen error Connection failed. Try again, shown in the figure below. To close the error and proceed with logging off, users must clear the cookies. But this is an invalid way to log off.

The incorrect logoff design described above also results in failures when Pega Web Mashups try to load. When stale cookies remain in the browser, the activity pzHandleUnknownSession is executed in the next request instead of the activities required to display the login screen. This results in undesired behavior.
501 Not Implemented
If the application server does not support the WebSocket protocol, you might see the 501 status code. However, this status should not affect push notifications because the transport mechanism automatically falls back to HTTP long-polling. HTTP long polling efficiently handles the data transmission between the server and the client.
Troubleshooting checklist
Now that you understand what HTTP requests and responses are, how they behave, status codes that indicate failure, and basic techniques for isolating the root cause of an HTTP request or response failure, use the following checklist to aid your troubleshooting effort. This checklist is also important if you need to request support service from Pega Global Client Support (GCS).
- What is the product and task context?
Identify the feature where the issue occurred and the task you or users were performing using the product. - Is this a new issue?
- Have you seen the issue previously?
Identify the Pega case reported (SR or INC). - When was issue discovered?
- Have you reproduced the issue?
Identify the Steps to Reproduce (in numbered list format with task and product context) - What has changed in the target system environment?
Identify deployment topology details that have changed or are relevant. - Does issue occur in all browsers? Some browser? Which versions?
- What error is shown on screen or reported in logs, if applicable
- Describe the expected behaviour or results.
- Describe the incorrect behaviour or results you or other users experience.
- Provide the minimum required artifacts from the target system (where the issue manifests)
- Screenshots of the Stream Rules or activities involved if available
- System State Json (SystemState-Cluster_yyyymmdd.json)
- Prconfig.xml file
- DSSes
- DASSes
- RASSes
Configuring dynamic system settings - PegaRULES logs
- Pega Trace
- Fiddler Trace
- Network topology (node type classification, Load Balancer and reverse proxies)
- Access logs (with XFF and cookies enabled if viable)
Related content
SECU0001 alert: Unexpected properties received in HTTP request
