Authored by Suhail Irfan
This document provides a checklist for development engineers and teams who use Pega Platform to develop high-performant solutions. The checklist focuses on solutions developed by using Pega Platform™ and tools and features provided out of the box to ensure production readiness.
The following section lists the Performance checklist and general best practices that need to be underwent during development phase and before product release.
PDC - Right place to tackle performance alerts
Be it on premises or PegaCloud, it’s important that you start monitoring your Pega-based solutions in Pega Predictive Diagnostic Cloud™ (PDC), even during the development phase, as a daily routine to diagnose, troubleshoot, and resolve performance issues.
PDC provides tools for closely monitoring and precisely assessing your Pega Platform performance. By knowing the areas that need improvement, you can thoroughly investigate and effectively deal with unexpected or unwanted behavior of your system.
The data that PDC presents gives you an in-depth view of various issues and events in the system, which increases your control over the way Pega Platform operates and helps you eliminate errors. Sensitive data is safe and secure because PDC receives only diagnostic data, filtering out all personally identifying information (PII).
With detailed insight into your system’s operations, you can promptly identify and resolve issues to optimize features and maximize performance.
Use the information that you gather to decide on the best way to proceed. Choose the Improvement Plan report or enable continuous notifications about specific events, and then use the findings to inform users about the system health.
PDC monitors and gives a variety of alerts ranging from PEGA0001 – PEGA0110, which are based specifically on performance.
Typical performance alerts captured in PDC
| Alert | Category |
| PEGA0001 - HTTP interaction time exceeds limit | Browser Time |
| PEGA0002 - Commit operation time exceeds limit | DB Commit Time |
| PEGA0003 - Rollback operation time exceeds limit | DB Rollback Time |
| PEGA0004 - Quantity of data received by database query exceeds limit | DB Bytes Read |
| PEGA0005 - Query time exceeds limit | DB Time |
How to start monitoring your systems with PDC?
Getting started with Pega Predictive Diagnostic Cloud
Various types of performance alerts:
List of events and notifications in Predictive Diagnostic Cloud
To configure PDC on premises:
Configuring on-premises systems for monitoring with PDC
If you are still unable to configure PDC, try using PegaRules Log Analyzer:
https://community.pega.com/knowledgebase/articles/performance/how-use-p…
Database performance and top queries
When it comes to performance bottlenecks, databases are one of the main suspects. To avoid issues that are related to the performance of database and database queries, monitor your database and queries regularly.
The things that you need to check are:
- Based on your application's data design and anticipated growth patterns, ensure that you have created indexes on key data columns.
- Make sure that the database queries response time falls under the SLA defined by Pega Platform alerts and tune them, if required. Also look for other database-related alerts in PDC.
- Make sure that your database query retrieves data from the right columns and not more than the required columns.
- Make sure that the same database query is not run multiple times or repeatedly than required; you can check this by tracking the count of executions in PDC or in PAL readings.
- Find the top queries with respect to response times and counts and address them.
For solutions hosted on Pega Cloud environments, PDC is available by default and can be used to monitor database metrics and top query Statistics.
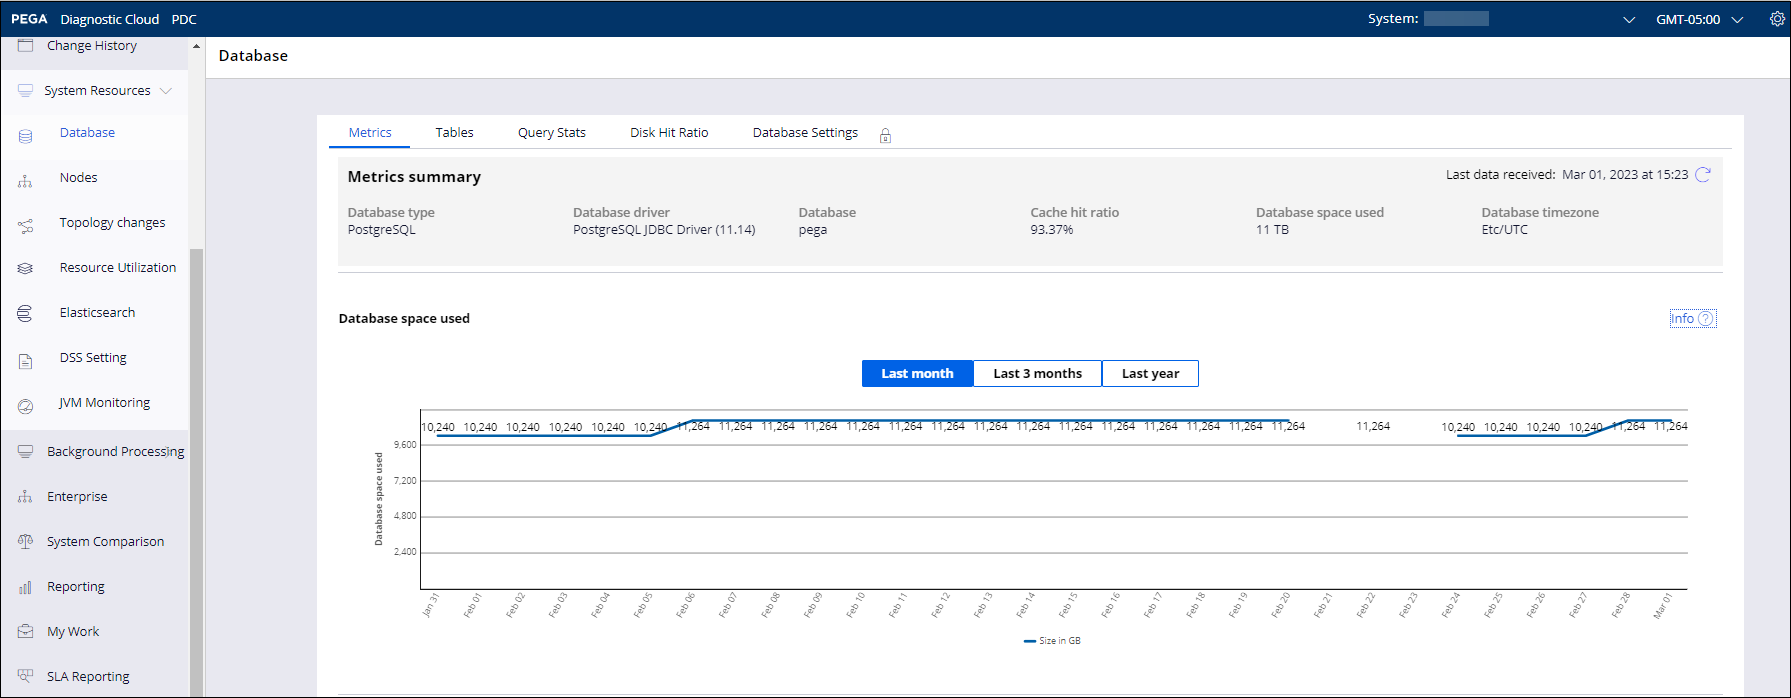
For non-Pega Cloud environments having a PostgreSQL database, you can execute the following to get top-running queries on the system.
- Enable pg_stat_statements extension in the Postgres database
- Use the following query to get a list of top 10 queries by execution time:
> select query, total_time, calls, total_time/calls avg_time, total_time*100/(select sum(total_time) from pg_stat_statements) percent , rows, shared_blks_hit, shared_blks_read , shared_blks_dirtied, shared_blks_written from pg_stat_statements order by avg_time desc,total_time desc limit 10
Apart from the above you can also set few Databases Alerts
Setting database alert thresholds
One such scenario would be to identify database queries that return large amounts of data, and thus are candidates for tuning, set the Byte Threshold. This feature is off by default. The warning threshold warnMB writes a stack trace to the alert log. The error threshold errorMB writes a stack trace and additionally halts the requestor. Thus, setting the warnMB entry to 10 will provide insight into which queries are requesting 10 MB or more of data. However, setting the errorMB entry to 50 halts the requestor only if a database query returns over 50 MB of data. Based on the alert log results, adjust these settings periodically according to your requirements.
<env name="alerts/database/interactionByteThreshold/enabled" value="true" />
<env name="alerts/database/interactionByteThreshold/warnMB" value="15" />
<env name="alerts/database/interactionByteThreshold/errorMB" value="500" />
Measure clipboard size and requestor sessions
The clipboard display shows the contents of the clipboard, but not its size in bytes. Large clipboards can affect performance because memory in the Java Virtual Machine (JVM) supporting the Pega Platform holds the clipboards of all requestors.
You can use the Performance tool to see the size of your clipboard in bytes or to track the growth and contraction of your clipboard over time.
- Make sure that for an end user requestor size remains under an acceptable limit.
- Make sure that obsolete and dead data pages are removed, memory gets cleared regularly, and check memory leaks.
- Have a check on heavy data pages in your requestors and threads and reduce their footprint if possible.
Also Monitor and adjust the number of requestors in the batch requestor pool.
To alter the number of requestors in the pool, use the agent/threadpoolsize setting in the prconfig.xml file or DSS. Monitor the thread level pages as well to ensure and limit the amount of clipboard usage to required data only.
Ways to measure clipboard size:
https://community.pega.com/knowledgebase/articles/application-developme…
Clipboard tool:
https://community.pega.com/knowledgebase/articles/application-developme…
Define and set target SLAs
It’s always better to have a target acceptable performance number in mind and setting an SLA across your solution can help you achieve this goal.
- You can set SLAs in terms of response times for the various critical HTML pages or screens that are loaded as part of your application usage by end users
These can be validated by running performance tests by using open source performance tools like JMeter, Gatling, Fiddler, etc. Alerts from Platform - PEGA0001 - HTTP interaction time exceeds limit and PEGA0069 - Client page load time are handy alerts that can be leveraged here with their default SLA.
- Other key SLAs that can be set would be for DB Query execution times, Connect Total Time
Validation of these again can be done by running simple performance tests mentioned above or by running manual runs. Alerts from Pega Platform to look for are PEGA0005 - Query time exceeds limit and PEGA0020 - Total connect interaction time exceeds limit.
In case the SLAs are not met, you can debug the alerts for these transactions with Pega performance diagnostic tools, which are available on the Tracer and Performance tabs in the Dev Studio portal for SysAdmin user, namely PAL Reading, Tracer, Profiler, DB tracer, etc.


You can also set thresholds for alerts, for example.
HTTP interaction time threshold
The default threshold for HTTP interactions time is one second. If a particular interaction takes more than one second, the system writes alert PEGA0001 to the alert log. The setting for exclude Assembly is included here so that the initial Rule Assembly does not trigger alerts.
<env name="alerts/browser/interactionTimeThreshold/enabled" value="true" />
<env name="alerts/browser/interactionTimeThreshold/excludeAssembly" value="true" />
<env name="alerts/browser/interactionTimeThreshold/warnMS" value="1000" />
Other thresholds and system setting to look at:
https://community.pega.com/knowledgebase/articles/performance/performan…
Guardrail scores - Check your score
Guardrail score is a great way to look at performance when you want to develop performant solutions by using Pega Platform. It not only helps you gauge your application's current functional issues, but also helps you to identify serious performance problems.
Schedule a recurring Check on Compliance Score and make sure that it remains above a threshold, such as 90. Specific performance impact risks and their counts can be seen on the Compliance details tab. The urgency of these are categorized as follows:
Resolve Now: Severe Warnings that need to be addressed immediately.
Resolve before Production: Moderate Warnings that need to be resolved before production.
Selecting the number takes you to the current risk areas. Addressing these risks can help you in overall gain or stop degradation in performance.


As part of your scheduled checks, you need to also make sure that system performance metrics and average response times are under control and don’t degrade over a period.
How to check scores for your app:
https://community.pega.com/knowledgebase/articles/devops/85/viewing-app…
Metrics details:
https://community.pega.com/knowledgebase/articles/devops/85/application…
Additional considerations
Regularly monitor heap memory and set the right JVM configurations.
Heap memory trends can help you diagnose and troubleshoot memory-related performance bottlenecks, if any. Rising heap memory that is not getting Garbage Collected (GC) can be a potential performance issue and memory leak in your application.
Starting with Pega Platform 8.5.1, you can use PDC to monitor heap health in System Resources ---> JVM Monitoring and GC activity available in events.
Thread dumps are other parameters that if created are also available in logs to be analyzed.
How to monitor heap memory by using JMX
If you do not use PDC, you can still monitor by using JMX monitoring through open source tools like JvisualVM for insights into the JVM heap and thread details.
Use the following JVM arguments to enable JMX monitoring, port 9099 can be used to connect through JvisualVM:
-Dcom.sun.management.jmxremote.port=9099 -Dcom.sun.management.jmxremote.authenticate=false -Dcom.sun.management.jmxremote.ssl=false ].
Typical heap memory usage issue using JVisualVM
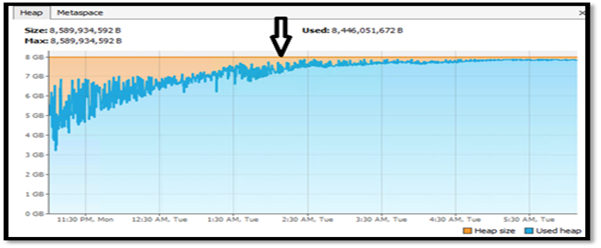
Pega Platform JVM configurations best practices:
https://community.pega.com/knowledgebase/articles/performance/jvm-confi…
Setting up and configuring Hazelcast for on premises:
https://community.pega.com/knowledgebase/articles/configuring-client-se…
Archiving and purging work items and related data
As the number of work items in the database grows, older or inactive work items and their related data need to be archived or purged. For guidance, see:
https://community.pega.com/knowledgebase/articles/system-administration…
Production-level settings
Set the system's production level according to whether it is a test or production environment. By default, this setting is been taken care of on Pega Cloud production environments, but for on-premises environments use a production level of 2 for development systems and 5 for production systems. This setting will also help you manage the logging level accordingly.
Also, have regular checks on background dataflows that have been set up to create data. If not in use, they need to be stopped along with QueueProcessor as they might be quietly creating data in background as per schedules.
How to set production level:
https://community.pega.com/knowledgebase/articles/system-administration…
Design and run load testing to validate the business use
While many tools are available to carry out load testing, you can start with JMeter for running performance tests. You may also consider reuse of functional test cases written by QAs as well for performance testing by using Karate testing, for example.
Design the load test to meet the business use of the solution. This means executing a test that is as close as feasible to the real anticipated use of the solution developed. It is important that your performance tests are designed to mimic the real-world production use. To ensure that this happens, identify the right volume and the right mix of work across a business day. Always do the math, to ensure that you understand the throughput of the tests and be able to say that in any n minutes, the test had throughput of y items that would represent a full daily rate of x items, which is A% of current volumes of V/day.
Things to remember while carrying out load testing:
Ensure adequate data loads
Make sure that loads are realistic and enough data is available to complete tests in the time period! Many performance issues first become evident in applications that have been in production for a certain period. Often this is because load testing was performed with insufficient data loads. As a result, response-time performance of the data paths was satisfactory during testing.
For example, the performance of a database table scan can be as effective on a table, with a certain number of records, as a selection through an index. However if the table grows significantly in production and a needed index is not in place, performance will seriously degrade.
Measure results appropriately
Do not use average response times for transactions as the absolute unit of measure for test results. Always consider service-level agreements (SLAs) in percentile terms. Load testing is not a precise science; consider the top percentile user or requestor experience. Review results in this light.
- For transaction intensive solutions/applications ("heads-down" use) a recommended value is 80 percentile.
- For mixed-type use applications, use 90 percentile.
- For ad-hoc, infrequent type use, a 95 percentile average will provide a more statistically relevant result set than 100 percentile of the average.
After you have understood and calculated the above considerations, start working on running your solution under a specified goal. You can run multiple types of performance tests like Load tests, Scalability Tests and Long Duration – Soak test, etc.
Typical load testing graphs

Response times versus virtual users (JMeter-Grafana)
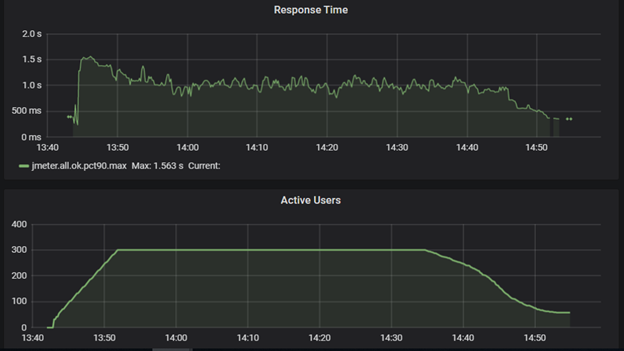
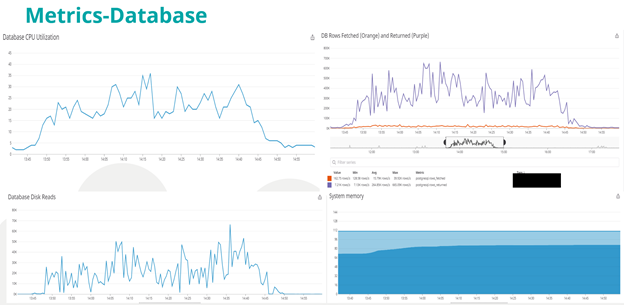
Monitor PDC for performance metrics related to system resources, alerts, and database for database queries. You can also set up external monitoring tools like Datadog to capture server health metrics. If Datadog is not available, use the sar/vmstat commands in Linux to track these system metrics.
· system.cpu
· system.io
· system.load
· system.mem
…………
*Metrics captured on Datadog
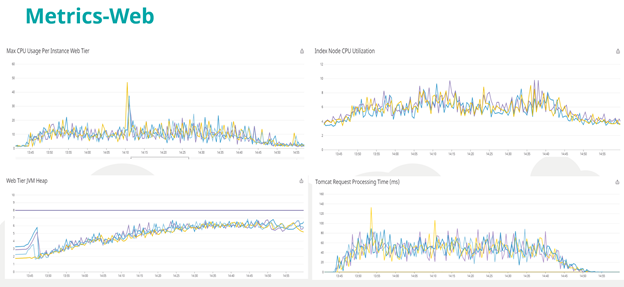
As a best practice, periodically visit and repeat the above steps in the Performance checklist during your entire development phase of the solution to be able to deliver performant and reliable solutions.

@ocont Hi, Thank you so much for the detailed article on PDC this is very very useful... The first two links are not working can you please relink it ?