Question
NFCU
US
Last activity: 1 Jun 2022 10:07 EDT
PEGA0095 Alert- IH Aggregation Read Latency
Hi,
I tried finding details around PEGA0095 under the list of Alerts but did not find any mention of this alert! We have encountered this alert during execution of a Data Set rule of Summary type( Interaction History)
In my application, We are using a Summary Data Set which is sourced from Interaction History. We have added few aggregates based on business requirement. Recently after this change, we are seeing an increase in container response time. When we tried to run the simulation and trace the service rest rule, we can see few alerts with code 0095. It tells us that its about IH aggregation read latency.
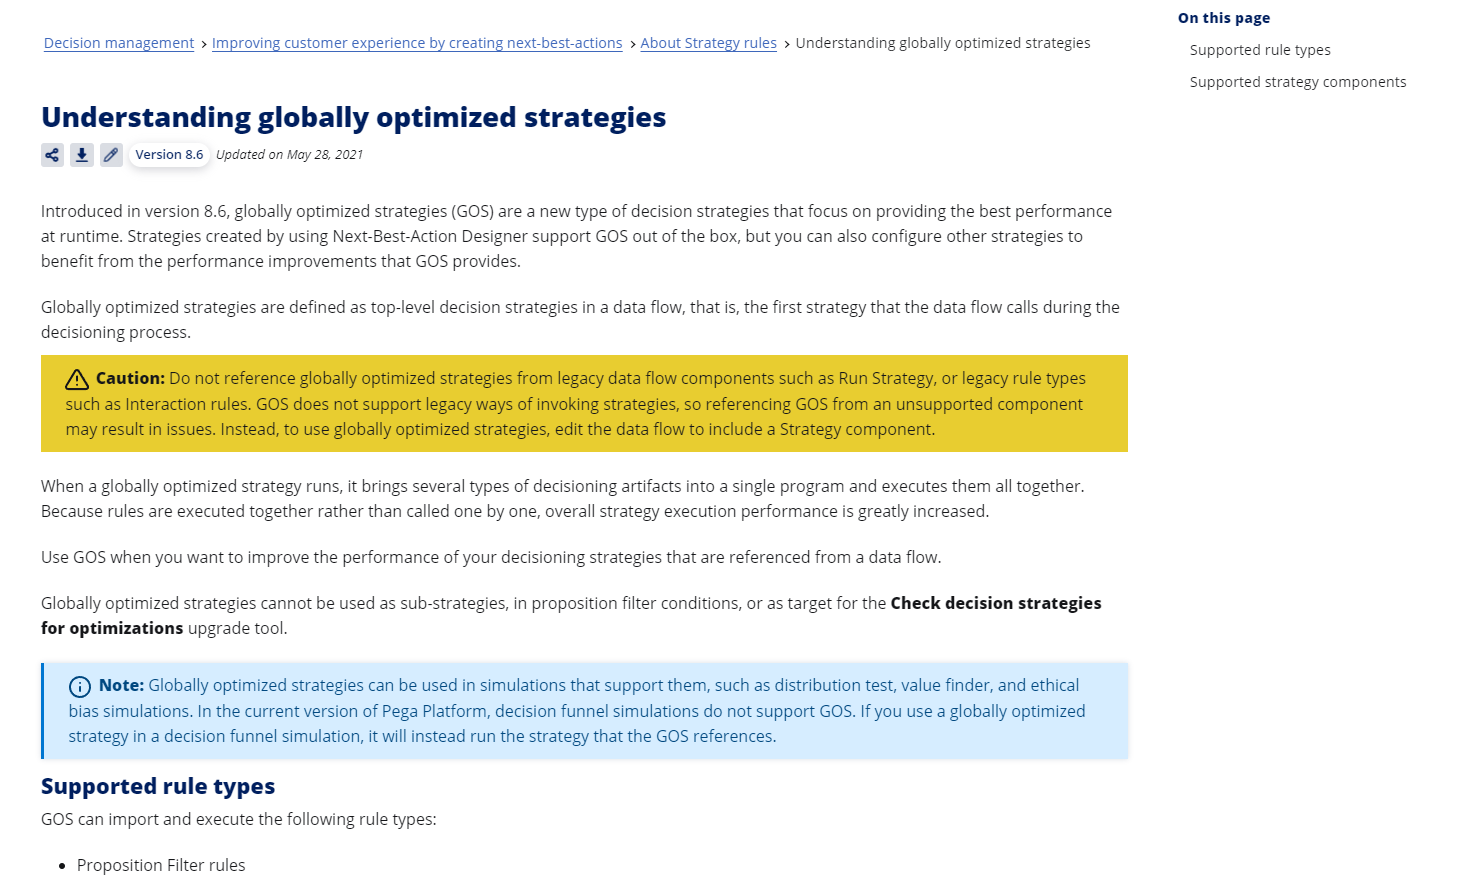
Below is the detailed info from Tracer(If this is of any help). What should be the way to fix this issue? Looks like IH Summary rules cant be optimized as part GOS optimization so need to check what other options we have to deal with this alert.
Reading the IH aggregate XXXX-SR:XXABC took on average 86ms and it is above the threshold of 20ms.
Data flow metrics are: {"@class":"com.pega.dsm.dnode.api.metrics.PerformanceMetrics","counters":{"Total requests processed":12,"Total records read from database":3,"Total requests with extra records":3,"Percentage of requests that go to the database":0},"stopwatches":{"Execute strategy":{"elapsedNanos":3731846683,"timesCalled":1},"Process extra records total":{"elapsedNanos":164772888,"timesCalled":3},"Fetch extra records":{"elapsedNanos":296077,"timesCalled":3},"Commit batch to underlying processor":{"elapsedNanos":3810465688,"timesCalled":1},"Prepare to commit batch to underlying processor":{"elapsedNanos":4766,"timesCalled":1},"Load previous results for delayed learning":{"elapsedNanos":0,"timesCalled":0},"Add to batch before executing underlying processor":{"elapsedNanos":2654,"timesCalled":1},"Convert strategy results":{"elapsedNanos":0,"timesCalled":0},"Save results for delayed learning":{"elapsedNanos":0,"timesCalled":0},"Create prepared statement":{"elapsedNanos":3853964,"timesCalled":3},"Create sql query":{"elapsedNanos":343208,"timesCalled":3},"Load IH":{"elapsedNanos":1607,"timesCalled":1},"Fetch next result from DB":{"elapsedNanos":407,"timesCalled":3},"Build clipboard page":{"elapsedNanos":31818,"timesCalled":3},"Execute query":{"elapsedNanos":7490814,"timesCalled":3},"Load IH Summary":{"elapsedNanos":5033,"timesCalled":1},"Process request":{"elapsedNanos":259402134,"timesCalled":12},"Process extra record":{"elapsedNanos":79496,"timesCalled":3}}}

