If connectivity issues are preventing you from seeing data in PDC, the troubleshooting methods in this document can restore PDC to proper functionality.
This article can help if you are not seeing
- Home data
- Event Viewer data
- Slow Interactions data
- All Cases data in the Improvement Plan
- TOP5 data in the Improvement Plan
- TOP5 History data in the Improvement Plan
- Any other kind of PDC data
Step 1: Running a Diagnosis
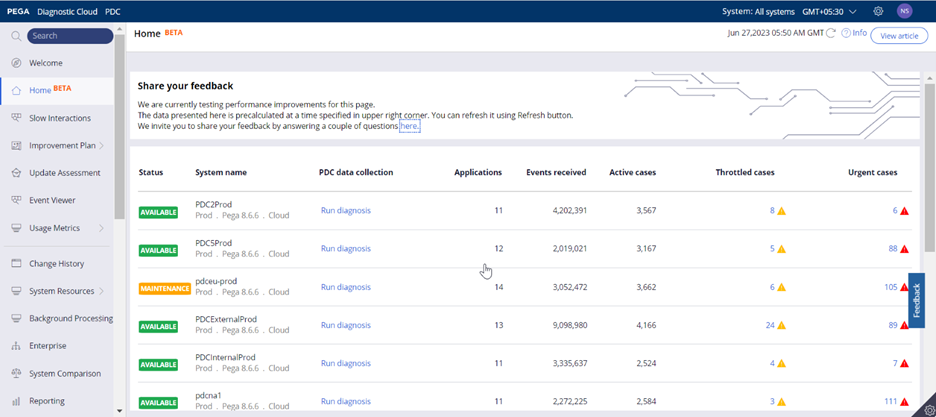
- Go to the PDC Home page in PDC (The data presented here is precalculated at a time specified in upper right corner. To get the latest data, click the refresh button).
- You will see one of the following status labels next to each system:
- AVAILABLE: REST and SOAP communication are successful and node information is received for that system.
- DISCONNECTED: Either REST or SOAP communication failed.
- OFFLINE: Both REST and SOAP communication failed.
- MAINTENANCE: The system is in maintenance mode.
- HIBERNATION: The system is in hibernation mode.
- LIMITED: Both REST and SOAP communication are successful, but node information is not received for that system.
![]()
- Check the status of the affected system.
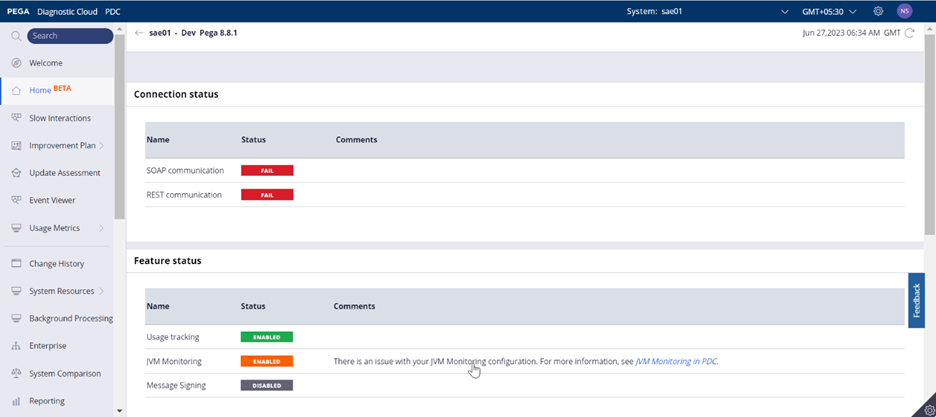
- If the status is DISCONNECTED or OFFLINE, click on Run diagnosis to verify the connection status for REST and SOAP communications.
- If REST or SOAP communication status shows FAIL, skip to Part 4 and follow the steps.
- Otherwise, continue to Part 2.
Step 2: Testing the Connection
- Log in to your PEGA client application.

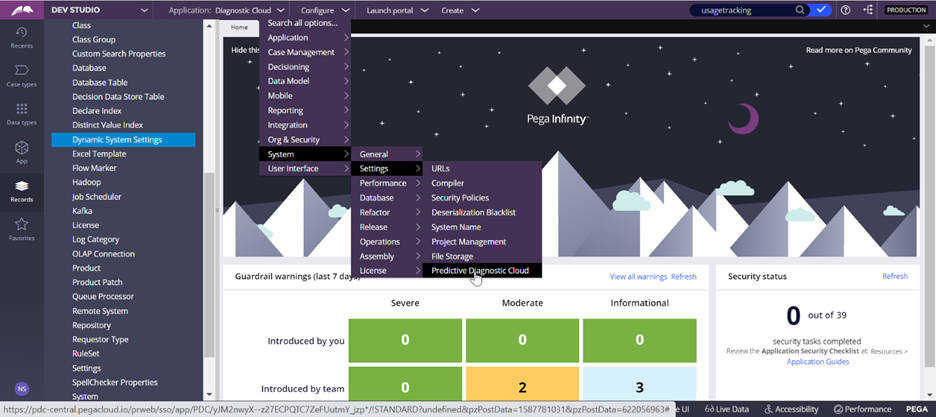
- Click Configure ---> System ----> Settings---> Predictive Diagnostic Cloud.
- Click Test Connectivity and check PDC connection status.
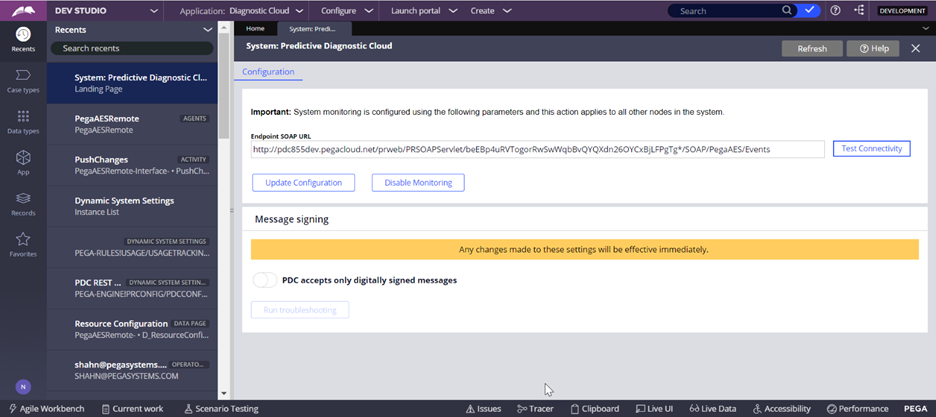
- If the PDC connection status fails, follow the steps in Part 3.
Step 3: Updating the Endpoint SOAP URL
- Log in to the PDC application.
- Go to the PDC welcome page.
- Copy the SOAP URL of the PEGA PDC Instance. To copy the url, click on the CLICK HERE link in "Step 2" as shown below.

- Log in to PEGA client application

- Click Configure ---> System ----> Settings---> Predictive Diagnostic Cloud.

- Paste the copied url into Endpoint SOAP URL and click Test Connectivity.

- If the connection status is successful, click Update Configuration and then click Save. You don't need to proceed to Step 4.
Step 4: Running data page D_ResourceConfiguration
- Log in to your PEGA client application.

- Open your operator ID and add Access Group “PegaAESRemote” if not already present.

- Then switch the application by clicking Application ---> Switch Application ---> PegaAESRemote.

- Search for Data Page “D_ResourceConfiguration”.

- Run data page D_ResourceConfiguration and check whether the RESTEndPointURL value is equal to the value in DSS “prconfig/pdcconfig/altresturl/default”.
- If not, remove the DSS value “prconfig/pdcconfig/altresturl/default” and save the DSS. The correct value will automatically populate.
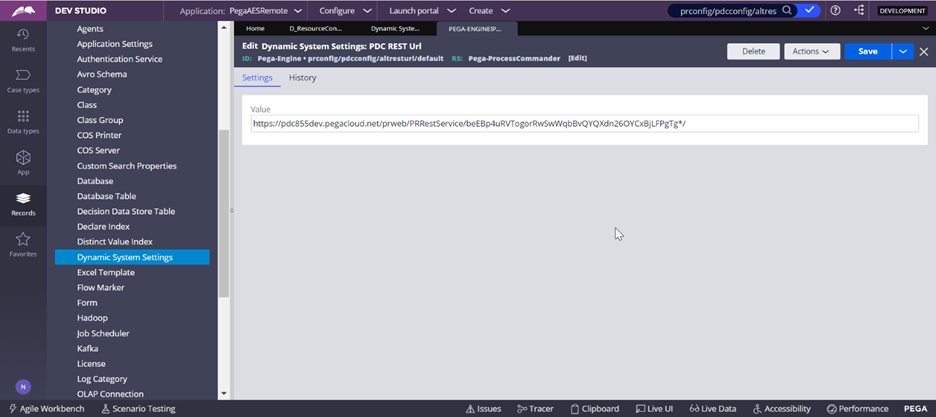
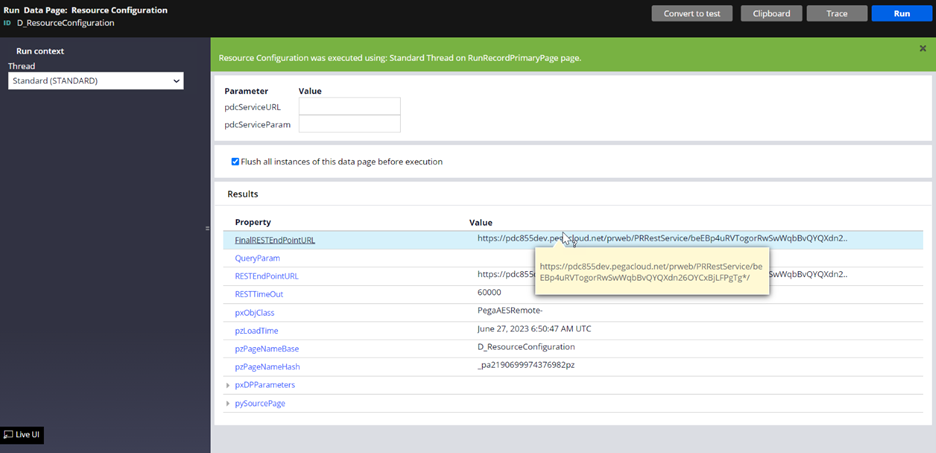
- Then run the Data Page “D_ResourceConfiguration”.
The actions you took in Step 3 or Step 4 should have restored connectivity, and you should see the expected data in PDC. If you are still not seeing the data you expect, you may need to restart an agent. It's also possible that no data is showing because there is no data to report. Review Expected causes of missing data in PDC.
