Discussion
Pegasystems Inc.
US
Last activity: 22 Nov 2024 10:40 EST
How to drilldown into a chart widget used in the dashboard of a Theme Cosmos application
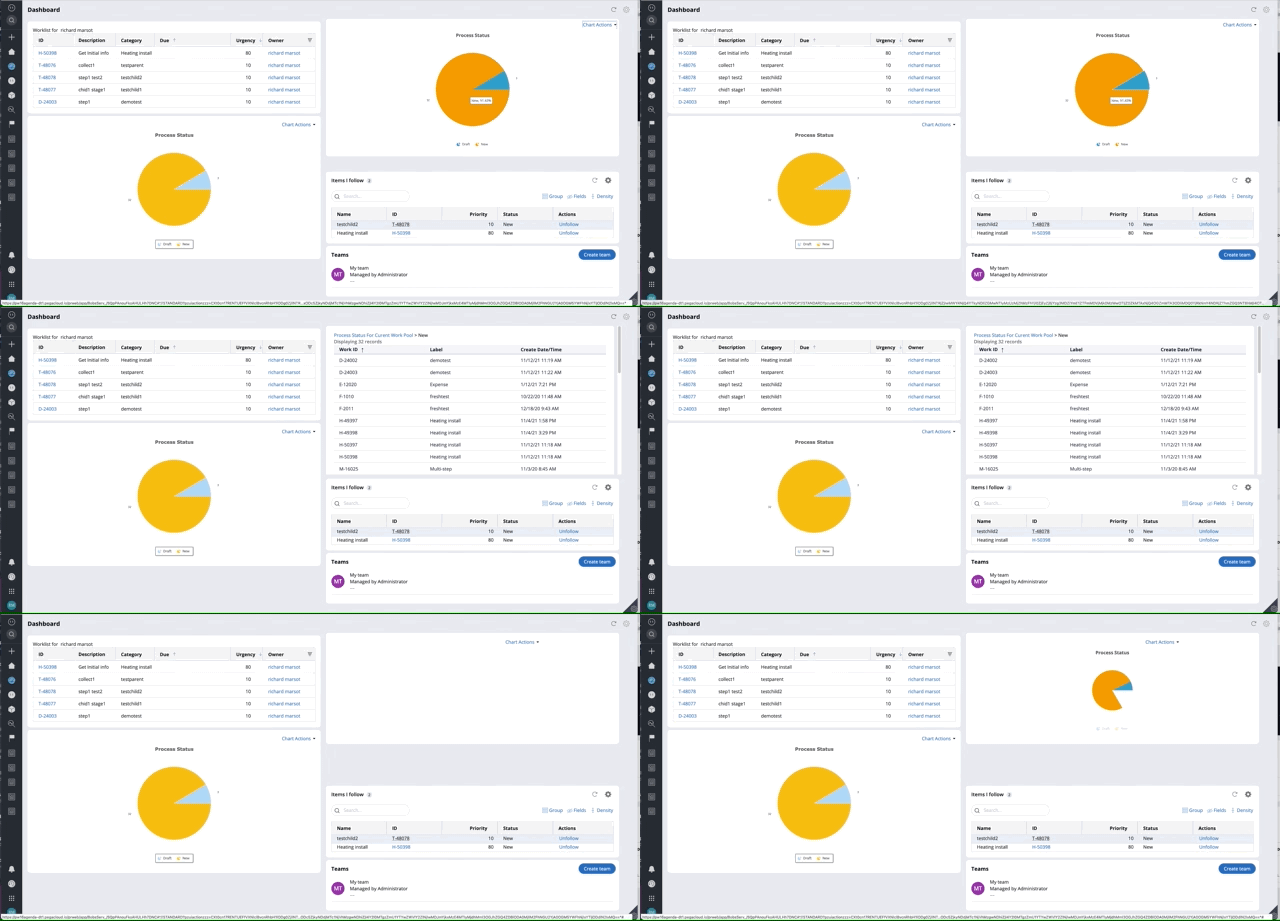
One of the requested feature is the ability to drilldown into a chart inside a dashboard using the current section based UI. This document will showcase how to achieve such functionality.

The report browser and the current chart generation functionality is being replaced by the new explore data page based on ReactJS - I strongly recommend to start exploring the new functionality available in 8.5 and higher - in upcoming releases, you will be able to create insights and add them to different dashboard. For more details on explore data:
- https://academy.pega.com/module/exploring-application-data-insights/v1
- https://docs-previous.pega.com/user-experience/86/explore-data
Note: The demo is done using Theme Cosmos 3.0 on a Pega 8.6 system - While this functionality might be working on older version of the platform (like 8.4 or 8.5), these changes are delivered as is.
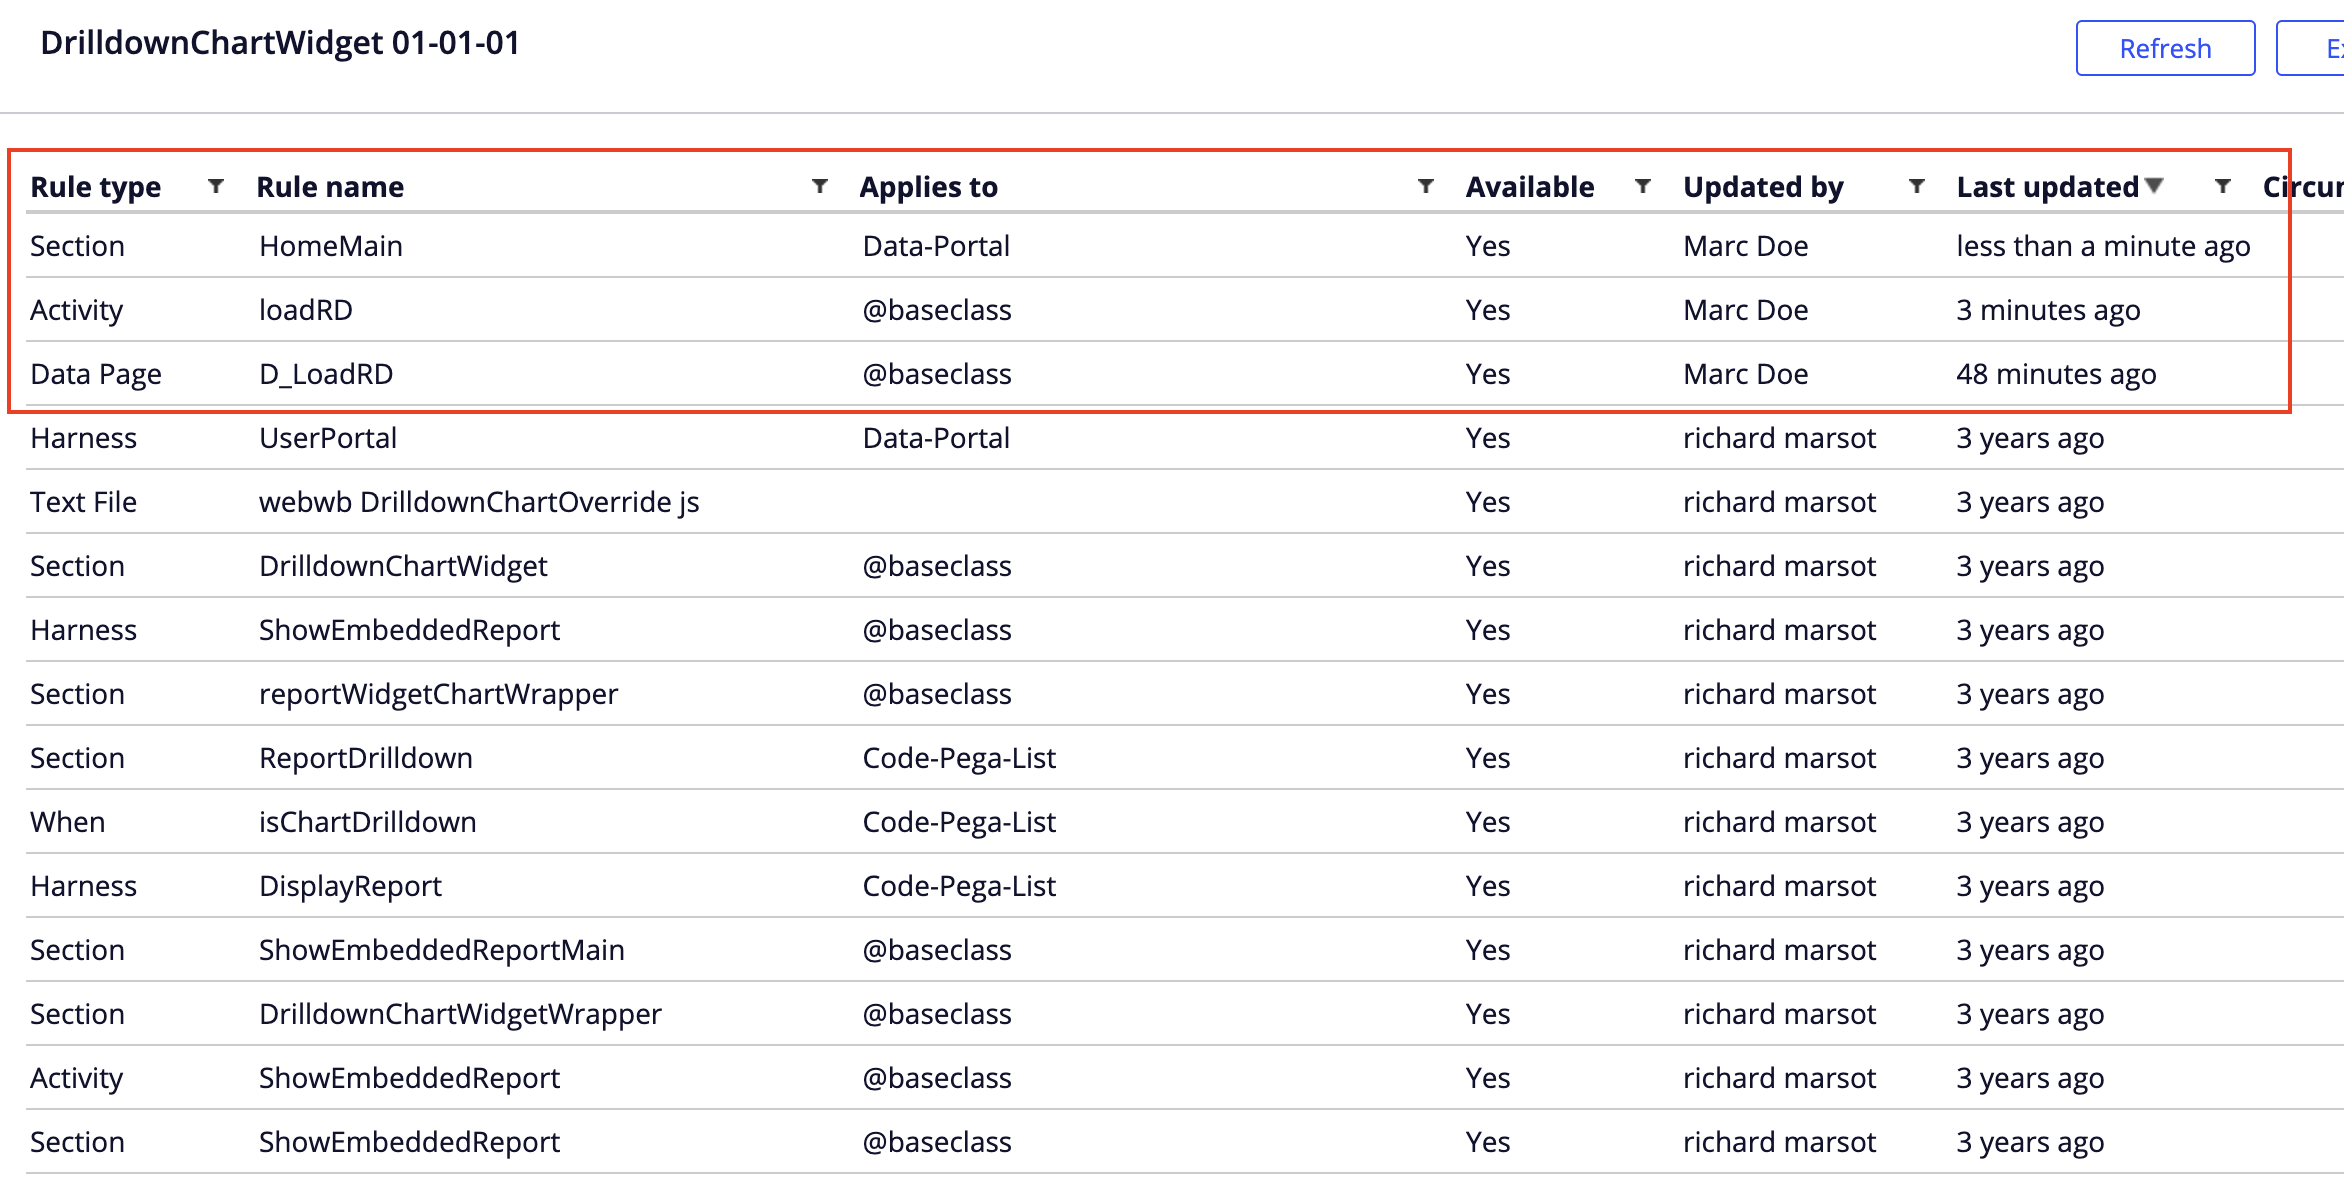
The changes are delivered as a new ruleset to add to your application stack - the ruleset contains a new widget and associated sections, JS to run the chart inside an embedded iframe. This provides the isolation from the rest of the dashboard page and allows to drilldown / drillup using the breadcrumb
Limitation of this functionality are:
1/ the iframe is a fixed height and does not auto-resize based on content
2/ dashboard preview and save does not work since the changes are not available to the inner iframe running on a separate thread - the widget will correctly repaint on publish of the dashboard
To use the new functionality, an end user will see a new widget called 'Drilldown chart widget' under the reporting category - the configuration is similar to the out of the box 'chart widget' - it is recommended to use a fixed height for the chart
You can watch the video for more details

