Adding a chart or graph to a report requires at least one column of
Fill in the missing words
Using charts and graphs help users identify trends or statistics quicker than sorting through lists of data. Adding a chart or graph to a report requires at least one column of ---------------- .
***Edited by Moderator Marissa to change type from Pega Academy to Product, update Platform Capability tags****
Accepted Solution
Updated: 11 Jun 2020 9:10 EDT
5 Stars Consulting Group
US
"Summarized data" is the answer.
The training system does not provide the correct answer. It needs to provide the answer after certain number of trials.
Updated: 1 Jun 2020 1:15 EDT
Evonsys
US
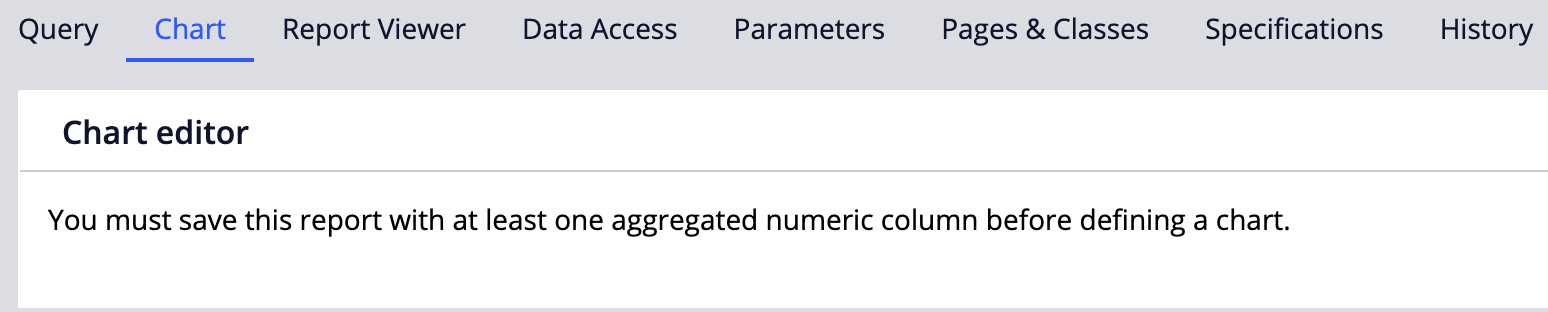
Hope this screenshot below helps. This is taken from Chart tab in Report Definition.
Evonsys
US
Can you try with summarized or go through below links and see if it helps to find exact word looking for?
https://community.pega.com/knowledgebase/articles/adding-chart-report
https://community.pega.com/knowledgebase/articles/working-charts-reports-pega-7
TD
CA
What is the correct answer to this question?
Also, fill in the blank type questions are so specific to a particular statement in the course, does not help with improving general understanding of the topic. Will it be possible to replace such questions in the future with more meaningful questions?
CBA
AU
Don't know the answer I tried filling the blank with my understanding but all the answers are wrong.
fill in the blank type questions are so specific to a particular statement in the course-- correct even wrong spelling is marked as error.
Pegasystems Inc.
IN
Only summarized reports can include charts. A summarized report has at least one column with a numeric aggregate value (a count, total, average, or similar value) and at least one group-by (unaggregated) column (case status, the day/week/month/quarter when items were entered, and so on).
Accepted Solution
Updated: 11 Jun 2020 9:10 EDT
5 Stars Consulting Group
US
"Summarized data" is the answer.
The training system does not provide the correct answer. It needs to provide the answer after certain number of trials.
Updated: 11 Jun 2020 7:48 EDT
Tools and Solutions
SA
Dear
How we can pass the quiz without answering this question, because it seems no answer for it.