How to debug pega constellation component and localization sync issues
In Constellation architecture all static assets are synced to Constellation static service so that we can have better caching and faster download.
How it works?
- Upon creating / publish custom component, sync will be triggered and custom component code will be pushed to Constellation static service.
- Sync happens while importing application as well, this will trigger Queue processor to send static content to service.
- Sync triggers upon save of Application rule or DSS setting "ConstellationSvcUrl".
How to debug?
We going to discuss:
1. Sync triggers upon save of Application rule or DSS setting "ConstellationSvcUrl".
2. View more sync log information on RAP import/Localization wizard
1. Sync triggers upon save of Application rule or DSS setting "ConstellationSvcUrl".
Enable the debugger log for sync functionality in Admin Studio, by default logs value is set to false.
- Admin Studio -> Resource -> Log Categories
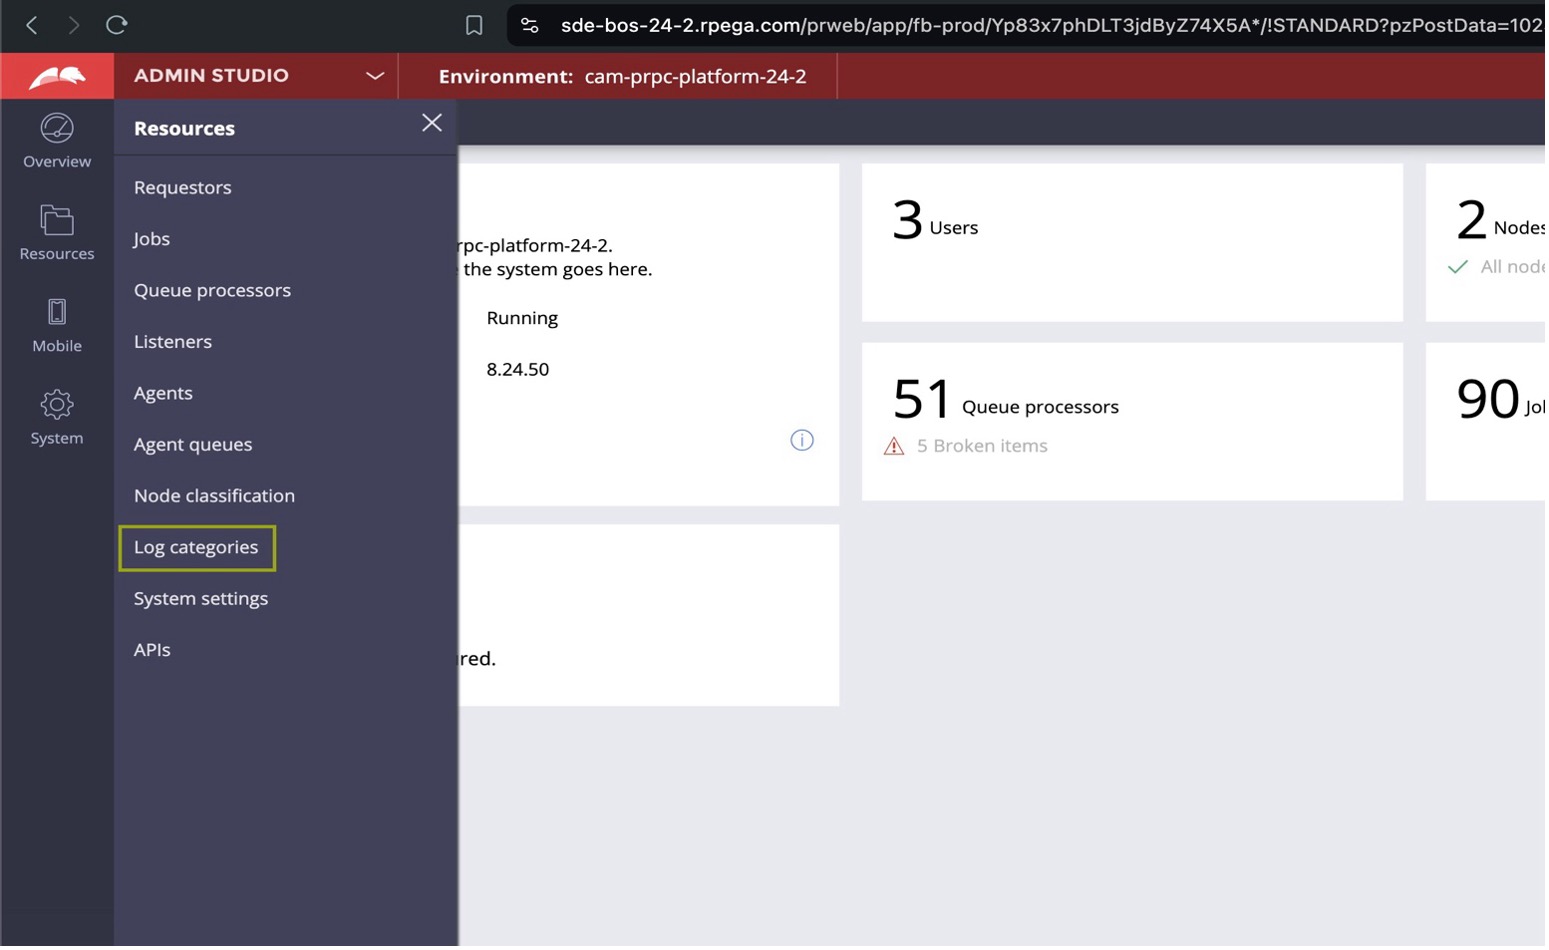
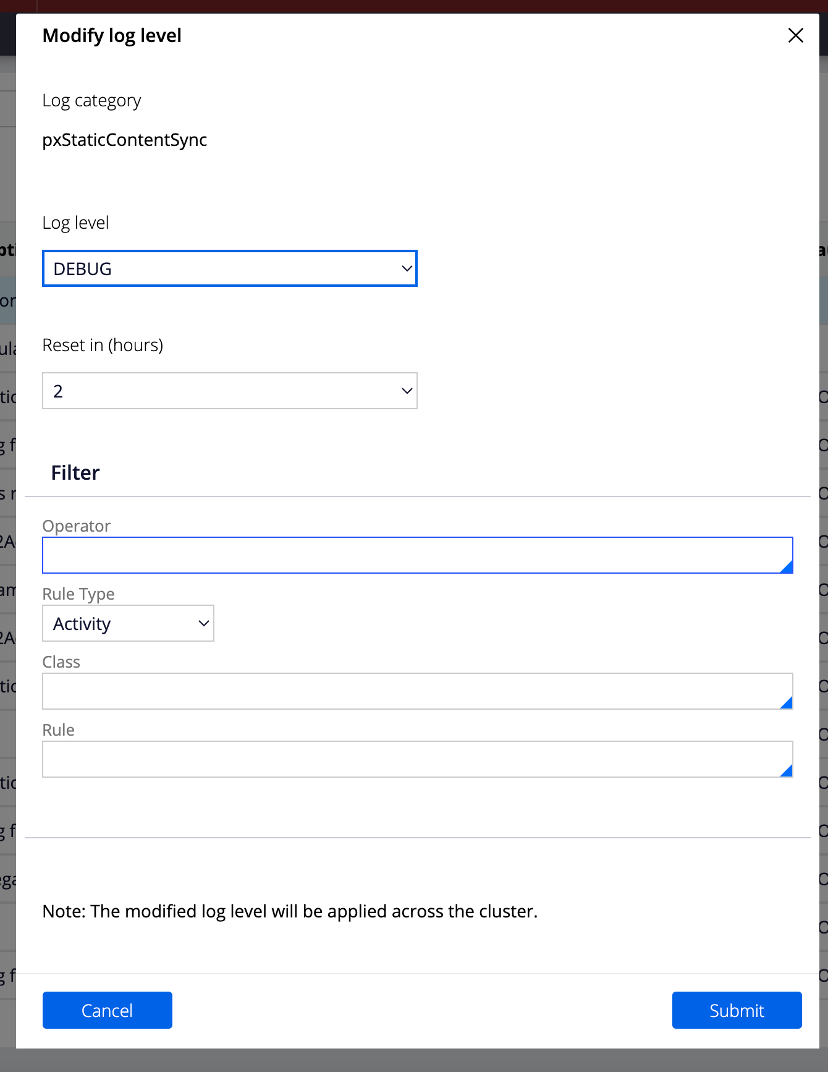
- Filter Category name by ‘pxStaticContentSync’

- Set log level to “DEBUG” for few hours and click on submit.
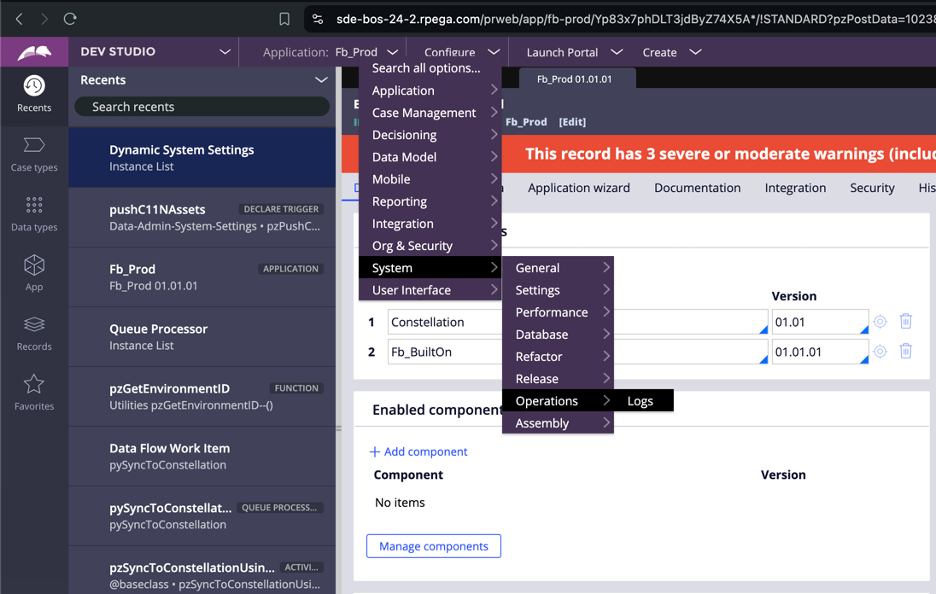
Viewing the logs in ‘Dev Studio’
- DevStudio -> Configure -> System -> Operations -> Logs
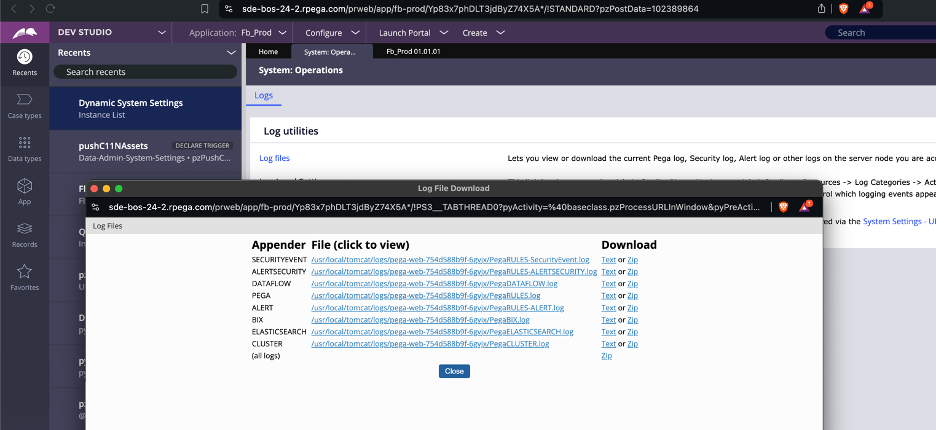
- Logfiles -> PEGA
2. View more sync log information on RAP import/Localization wizard
- In case of RAP import/localization wizard we use QueueProcessor to process the records. We can get more details about the logs in the QP along with Pega Logs.
- Admin Studio -> Overview -> Queue processors
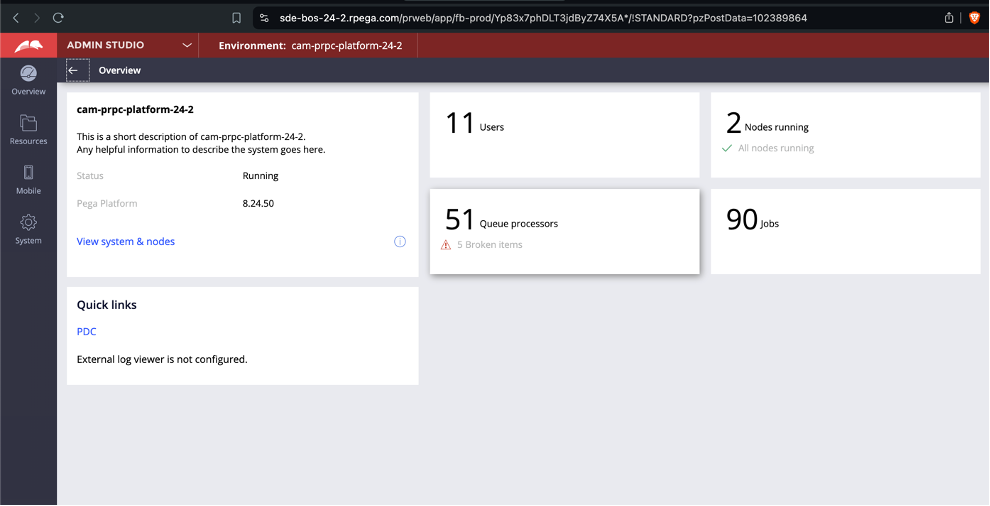
- Filter Queue processor by ‘pySyncToConstellation’
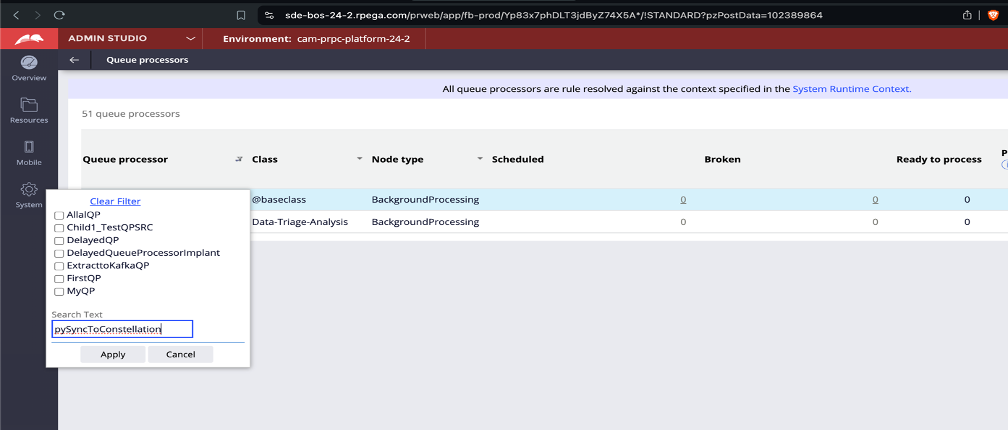
- If there are broken QueueProcessor items, click on that specific column.

- Click on View XML, you can more information about the failure reason under ‘pxExceptionMessage’ in the XML file.

- If we want to trace the application during sync process using QueueProcessor, we can also use the “Trace” option.

