Question
Last activity: 30 Oct 2015 5:11 EDT
Measuring "RDB I/O Elapsed" on SMA (Pega 7.1.9)
I am currently planning a performance test and trying to measure response time for database access.
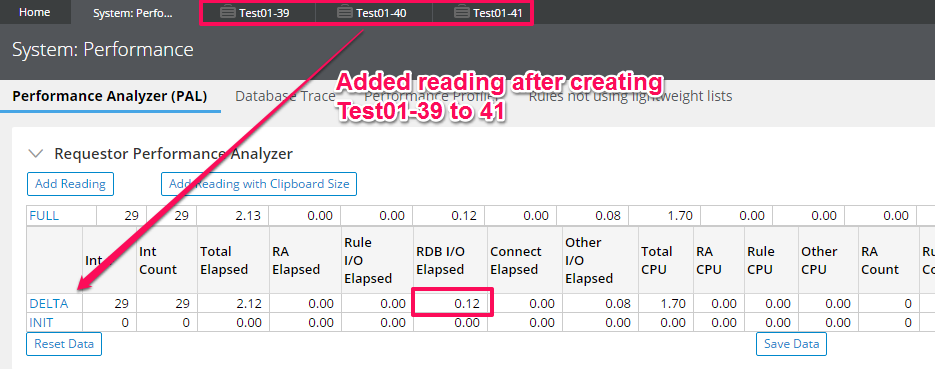
On the Performance Analyzer (PAL), I can get the "RDB I/O Elapsed" as a database I/O as shown below.
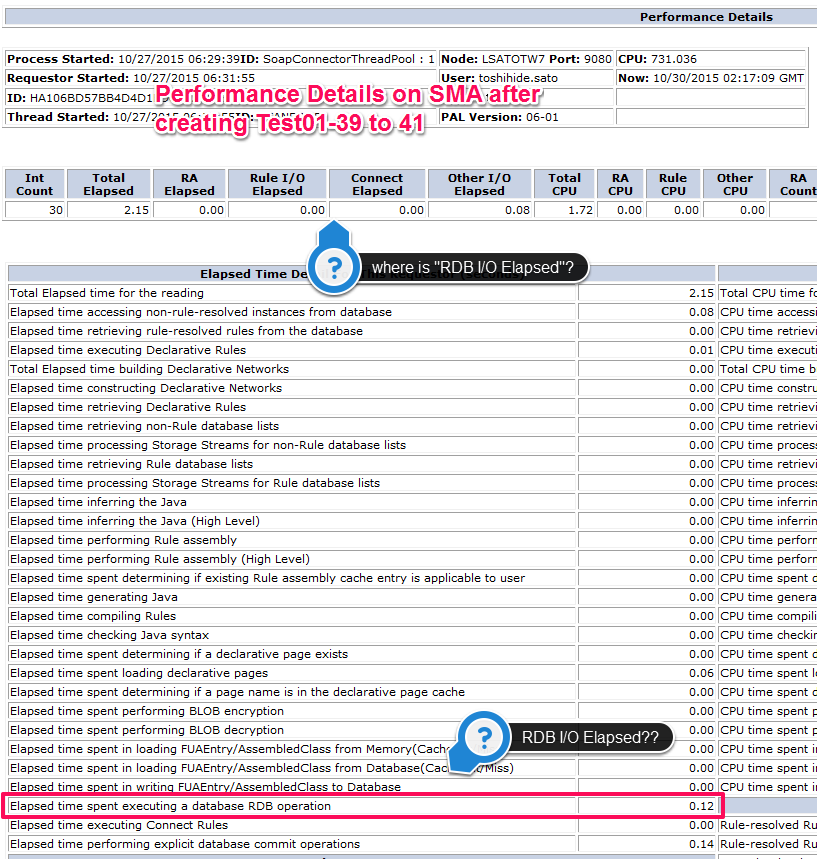
Since I would like to measure the RDB I/O for the other requestors as well, I was considering to use the SMA's Requestor Management function. I can pick a requestor from the requestor list and click "Performance Details" button to show PAL-like measurements like below.
However, in the performance details screen in SMA, it does not include "RDB I/O Elapsed" explicitly in the first row of data. By looking into details in "Elapsed Time Detail For This Requestor (seconds)" section, I can find a row named "Elapsed time spent executing a database RDB".
It seems like "RDB I/O Elapsed" in PAL and "Elapsed time spent executing a database RDB" in SMA are showing same value, but are they equivalent??


