JVM OutOfMemory : Memory leak
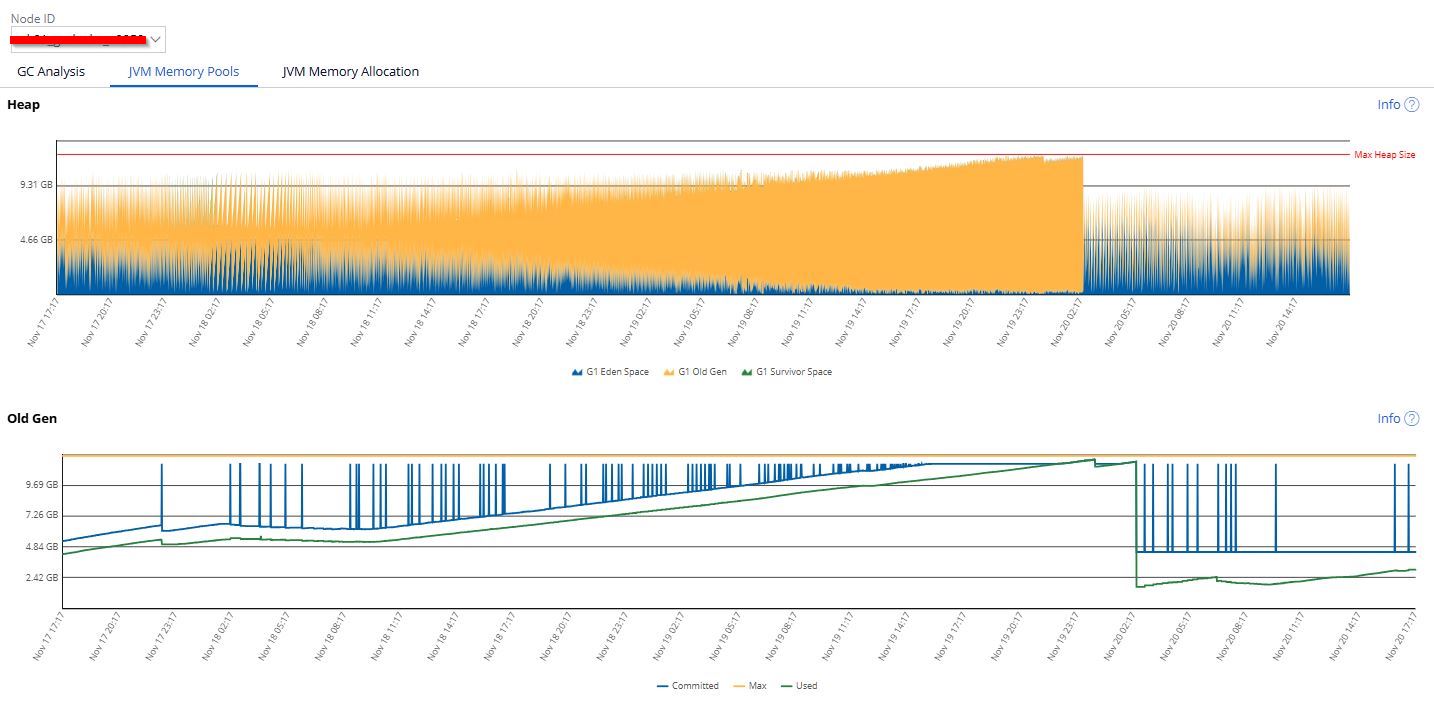
On our production environment, we have noticed memory leaks on nodes of type "Web User" and "Real Time" (4 out of 25 nodes in total). The JVM Heap increases until an OutOfMemory error occurs (see image 1), once or twice a week. These nodes consume external Kafka streams and receive service calls (REST API, HTTP, SOAP, etc.).
The number of received calls is relatively high:
- ~1M per week for HTTP calls
- ~13k per week for REST API calls
- ~2M Kafka streams consumed
It is not easy to identify the cause of these memory leaks. However, we have focused our research following the execution of the query (after consulting https://docs.pega.com/bundle/pega-diagnostic-center/page/pega-diagnosti… and https://docs.pega.com/bundle/platform/page/platform/system-administrati…):
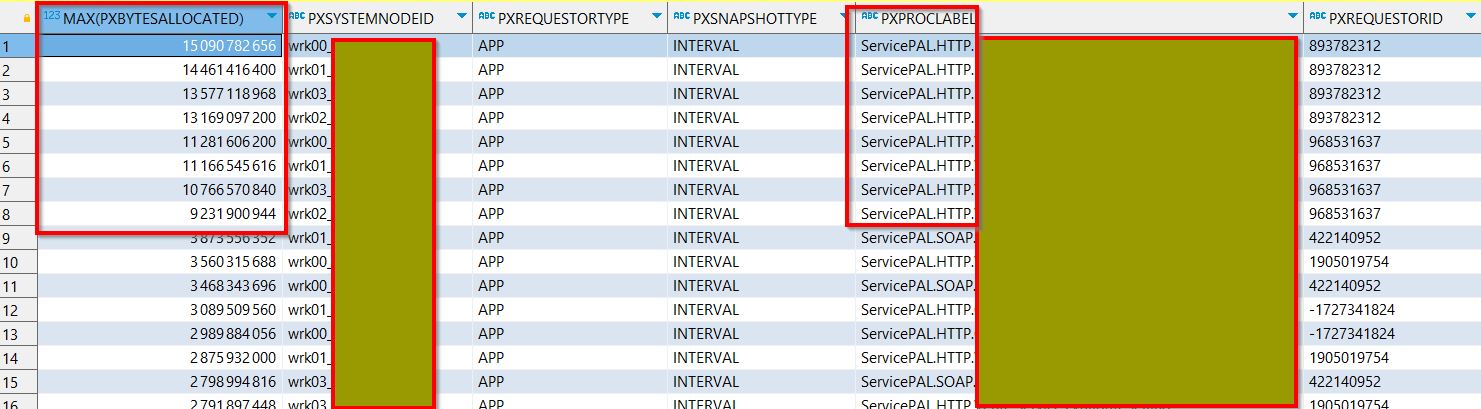
SELECT max(pxbytesallocated), pxsystemnodeid, pxrequestortype, pxsnapshottype, pxapplication, pxproclabel, pyuseridentifier, pxrequestorid
FROM pr_perf_stats
WHERE
    pxsystemnodeid like '%wbs%'
    AND pxbytesallocated IS NOT NULL
GROUP BY pxsystemnodeid, pxrequestortype, pxsnapshottype, pxapplication, pxproclabel, pyuseridentifier, pxrequestorid
ORDER BY max(pxbytesallocated) DESC;
This query shows snapshots with significant allocated memory on HTTP service calls across our different nodes (see image2). This has helped us focus our investigations on certain HTTP services. We then tried to reproduce this on a Quality Assurance environment, using the following process:
1. Enable logs to allow Requestor identification:
- pxIntegration.RequestorPools
- pxIntegration.Service.REST
2. Execute a "simple" API call belonging to Pega (/api/v1/nodes), with basic authentication.
3. Identify the Requestor:
2025-11-26 10:28:30,883 [nssl-nio-8443-exec-9] [          ] [                    ] (com.pega.pegarules.session.internal.mgmt.RequestorPoolManager) DEBUG host|ip  - Getting pooled requestor for service package api
2025-11-26 10:28:30,883 [nssl-nio-8443-exec-9] [          ] [                    ] (com.pega.pegarules.session.internal.mgmt.RequestorPoolCommonsV2) DEBUG host|ip  - activateObject: A090HZDOOT77KCLSNCFZ5EBA9QMZOL8YOA
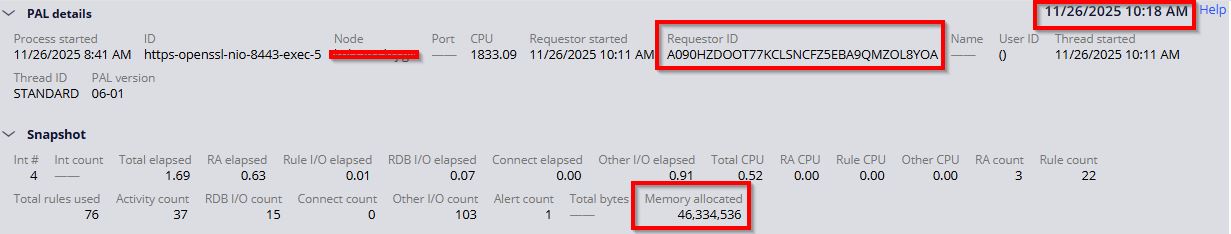
4. Record the "Performance details" of the identified Requestor (see image3).
5. Massive API calls (via PostMan) => 10k API calls.
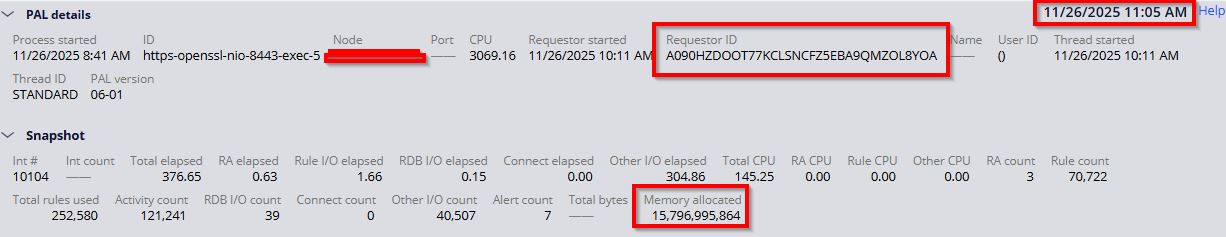
6. Record the "Performance details" of the identified Requestor (see image4).
On the last image, we can see that the allocated memory is increasing, and it never seems to be released.
Is this normal behavior? Is the memory truly never released?
Are there any other leads to identify the memory leak ?
HCA Healthcare
US
You are not really seeing a “never released” memory situation in PAL, because pxBytesAllocated is cumulative per requestor and keeps growing as long as the same pooled requestor is reused, so that value does not drop even when the JVM garbage collector actually frees heap. What you should focus on is the JVM side: capture a heap dump when the OutOfMemoryError happens and analyze which classes/objects are retaining most of the memory. Check your high-volume HTTP and Kafka listeners for patterns like very large clipboard pages, big responses kept on pages, data pages with “reload if older than 0” disabled, or Java steps that store large collections in static variables or requestor-level pages. Make sure each service closes streams, connections, and result sets properly, and that you are not caching huge objects in node-level or requestor-level data pages. Use PDC / Diagnostic Center to find which services or requestors have the largest pxBytesAllocated and longest elapsed times, then drill into those specific rules. Also review node and requestor-pool settings (max active requestors, timeouts, passivation) so idle requestors are recycled more often instead of living “forever” and accumulating allocations. If the leak seems tied to a specific Pega version or hotfix level, open a Pega Support ticket with heap dumps, GC logs, and PAL extracts so they can confirm whether this is a known platform issue or an application-level memory leak.
MGEN
FR
Thank you for your response, the PDC approach could be an interesting lead!
I also thought about doing a heap dump, but I'm a bit concerned about the file size and how to analyze it. Currently, I'm trying to connect the dots between requestor pools and consumed memory, based on the service package configuration.
HCA Healthcare
US
@ArnaudA Nice, If you do go ahead with a heap dump, tools like Eclipse MAT can help you quickly spot the biggest dominators, so the size becomes less scary. Correlating requestor pools, service packages, and high pxBytesAllocated in PDC is exactly the right direction; once you narrow it to a few suspect services, it usually becomes much easier to see where memory is being held longer than expected. Good luck!!