Question
Accenture Federal
US
Last activity: 17 Jul 2017 16:40 EDT
How to get the Current number of logged-in/active user's
Is is possible to get the Metrics for the Current number of logged-in/active user's out of PRPC 6.X I know that you can look at System Usage Summary but i am looking for information that is more comprehensive and closer to real time information from the system.
***Updated by moderator: Marissa to close post***
This post has been archived for educational purposes. Contents and links will no longer be updated. If you have the same/similar question, please write a new post.
-
Like (0)
-
Share this page Facebook Twitter LinkedIn Email Copying... Copied!
Accepted Solution
Accenture Federal
US
All,
I have resolved my inquiry. With jconsole and a software called twiddle.sh i have been able to communicate with the jboss instances on the back end, then i pass this information into the local monitoring agent for alerting.
#! /bin/bash
PEGA_ACTIVE_SESSION=$($TWIDDLE --user=$JBOSS_USER --password=$JBOSS_PASS -s localhost get "jboss.web:type=Manager,host=localhost,path=/prweb" ActiveSessions | cut -d'=' -f2)
echo "$PEGA_ACTIVE_SESSION"
This is only a snip-it of the script but it should produce the raw number of ActiveSessions.
Thank you all for your responses.
Pegasystems
US
It would be great to know in general how to look under the hood in SMA, such as by tracing SMA, so that for any piece of information that SMA is acquiring, we could see what Java call it uses to acquire it, in order to display similar information in our own Pega app screen.
For example, for Ray's situation, I can see that on SMA's requestor screen, it shows this:
Presumably, it tallied that "2" by looping over all the requestor info blocks and seeing which ones represent interactive requestors. If there were a way to see what Java SMA is using to acquire those info blocks, we'd know how to get the number.
Any of you know how to either trace SMA or to get the details of what to call in Java to obtain the same info SMA gets ? /Eric
BNY Mellon
US
Use the classic Pega API call pega.getConnectionsList(clipboardpage) to get a ClipboardPage list of users.
I do not know of an API to retrieve just the count. This is available through JMX (which is how it shows up in SMA, and AES), but there's no handy utility to show the count for each node, from within Pega.
See also:
https://pdn.pega.com/forums/prpc/system-operations/active-connections-list-shows-logged-out-users
Pegasystems Inc.
US
Jon,
Thanks for including your PDN Forum thread.
This a practice that we sometimes forget -- linking to available Pega and 3rd-party vendor information that community members have access to (even if it's info that was consulted without providing an answer or solution).
I'm wondering if Steve Madden -- that should be Steve Mekkelsen Madden [a Mesh bug] -- can offer any insight to this question. ??
-Mary
Hi Ray and everyone. What I use and rely heavily on is SMA. As Eric mentioned above, SMA does provide the current number of browser connections, services, batch processes, etc. in one glimpse. Directly below the Summary of Requestors Eric posted, shows all the requestors line by line and a brief status of their states. There are options on the Requestor Management page of SMA to get details, trace, profile, check clipboard sizes and content. From someone who manages 25+ servers daily, it is an application that is both reliable and one that I have open all the time.
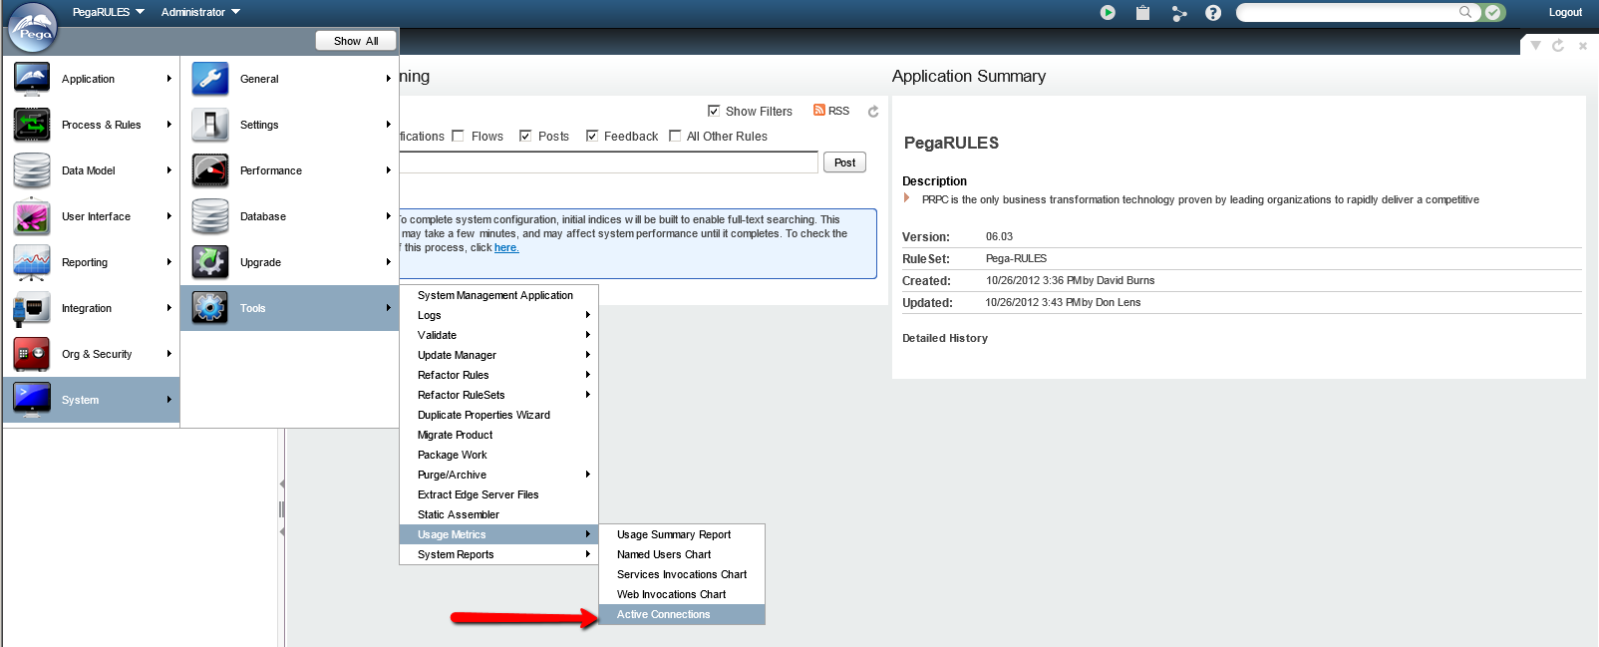
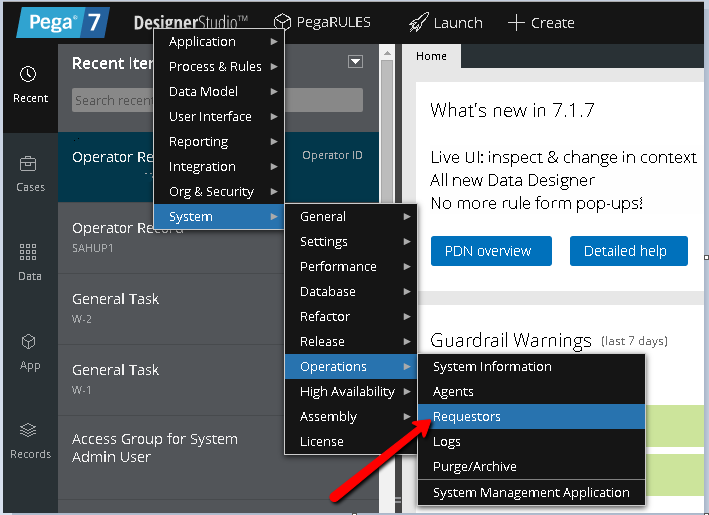
If you are logged into PRPC or Pega7, there are reports you can run to get historical information on requestors.
The first provides a summary report over time for Regular Users, Occasional Users, Services Invocations and Web User Invocations. The other three break it down graphically for you.
Hope this answers your question. -- Steve
Accenture Federal
US
So I have explored both of the options mentioned. My problem with utilizing the usage summary is it is not real time or near real time and it only provides a vague account of the usage. I have also looked in SMA and can see the requestor's as Steve mentioned but i have approximately 20 servers in one environment and 40 in another. There are to many system to just click through, i would spend my whole day just looking at one parameter. I have been exploring utilizing twiddle.sh to extract information from the back end but i cant seem to find the appropriate mbean to query. At that point i can wrap it in a shell script and pipe the output to my monitoring tool for alerting.
Hi Ray, that provides me with more detail and I certainly can emphasize with what you have to do. Having multiple nodes and being required to connect to each one, then click Requestor Management to get a count is good for a few nodes, but certainly not for the volume you have. It sounds like you need a monitoring tool, for a monitoring tool (SMA) - one that grabs the counts from each node and returns to a single UI. That would require an API to PRPC/Pega7 to accomplish what you're doing. I'm not sure it exists currently, but I'll do some investigating and see what I can come up with for you if this is indeed what you're looking for? - Steve
BNY Mellon
US
re: "There are to many system to just click through..."
Indeed. SMA is extremely frustrating. It has not been updated in many years.
(AES kind of does this a little bettern than SMA, but not everybody has it. I actually haven't seen v7 in a while)
I assume, if you're like me, you want a clean display of the information:
Define my rows (this cluster of servers), define my columns (# of Requestors, whether agents are running), and generate a table from that.
I can post a doc of some of the useful mBeans. There is a tool called Jolokia which trasnlates JMX into JSON, which is easier to manipulate.
BNY Mellon
US
"...but i cant seem to find the appropriate mbean to query"
you need com.pega.pegarules.management.internal.MemoryManagement.RequestorCountSizeByType()
This will return XML, and the count of user requestors will be in this XPath - /RequestorSummary/browserRequestors
Asurion
US
Hi Jon ,
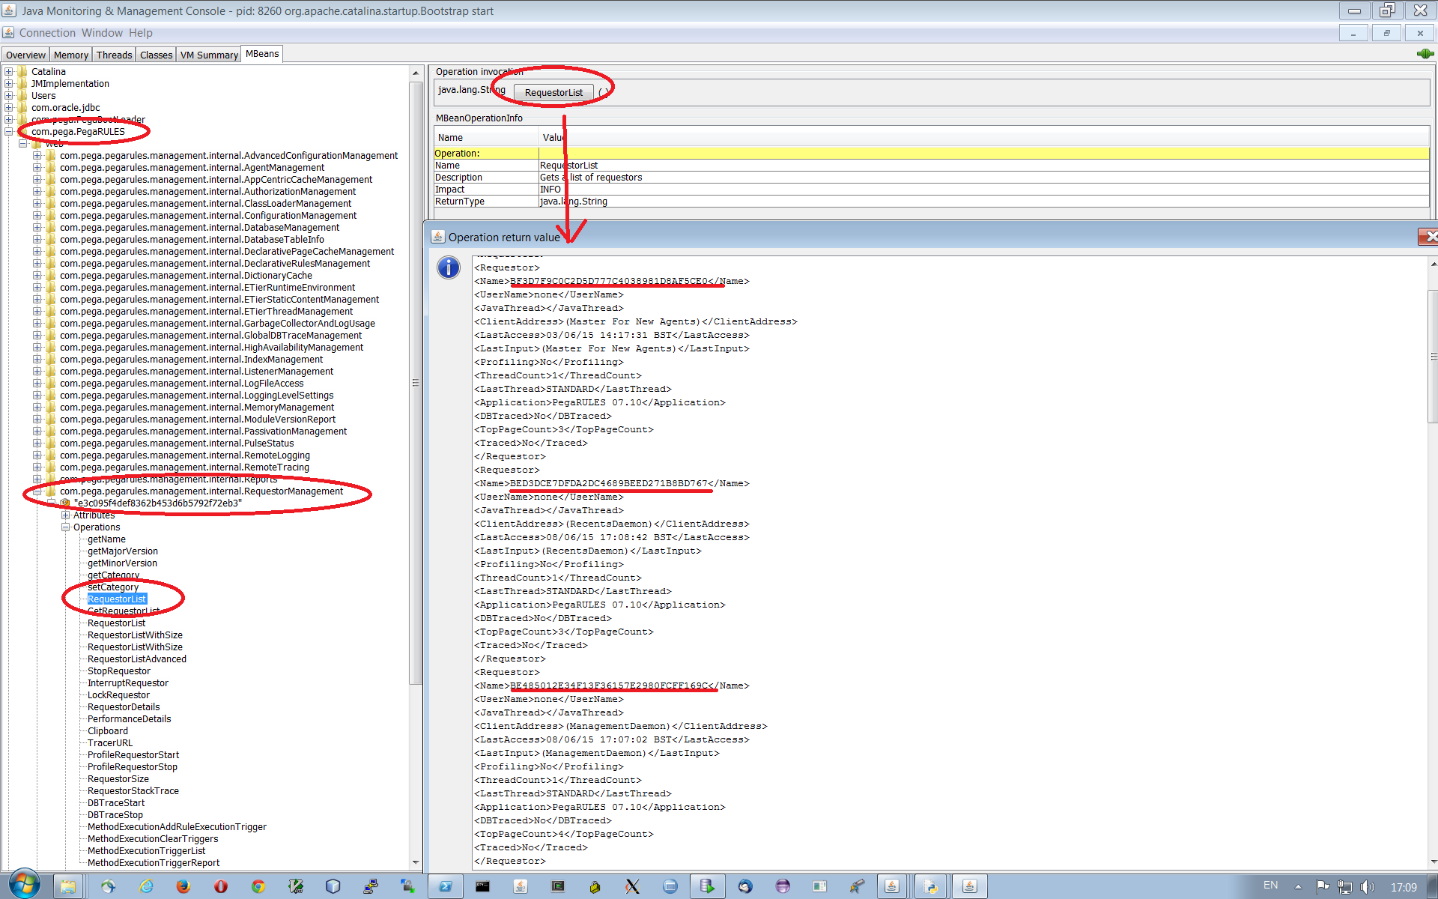
I think this will help com.pega.pegarules.management.internal.RequestorManagement.RequestorList() , to get the requestor details in a node.
Pegasystems Inc.
GB
Hi - I think Nagendran's answer is a good approach (assuming we are after 'Requestors' rather than just 'Connected Users') - here's a screenshot of using the JDK's built-in 'jconsole.exe' tool (on the same machine as PRPC's JVM - which is the easiest case - remote JMX requires additional security-setup etc) - running the method 'RequestorList':
Accenture Federal
US
John Pritrchard-williams, Thank you for your feedback. the jconsole was exactly what i needed to explore the mbeans.
AIG
US
Hi John,
Can you provide me steps to run this jConsole on Pega-PVS.
How do I access jConsole of a remote ApplicationServer(for example on WebSphere) where Pega application is hosted, usually what port we can access this, what username and password we need to give. Do we need to set any security settings, if yes what are those settings. Please provide us details related to this.
Thanks
-Sudheer CH
Pegasystems Inc.
GB
Hi Sudheer,
Running JCONSOLE on the same physical machine as the JVM you want to monitor is the simplest test-case; where shared-memory/files can be used to exchange information. (And Logged-in Credentials can be used to authenticate the requests).
When connecting remotely to a 'foreign' JVM - you need a whole load more setup to make it work - including security settings.
This is outside of the scope of PRPC however: and you need to consult Sun's (and possibly IBM's) documentation for this setup: Using JConsole - Java SE Monitoring and ManagementGuide
I got this working once (a long time ago) - I seem to remember that you have to some a fair amount of configuration on the JVM itself (properties files) to allow Remote Clients to connect to the JVM - and you have get file ownership/permissions correct as well. (Since you don't want just anybody connecting into your JVM and reading its mind....)
Sorry I couldn't provide an exact steps here.
Remember though: you can access JMX 'mbeans' locally without having to worry about transport and security - so you can build PRPC Activities (which are running with the *same* JVM of course) to 'poke' the mbeans directly as well...
Cheers
John
AIG
US
Thanks for the details John.
Based on your response,looks like getting access to jConsole of a remote application server is not easy. Can please tell me where can I get the list of Pega PRPC related MBeans and its operations.
Our goal is without using SMA, we want to get the following details on each node of a cluster. We do not want to verify this manually on each node through SMA.
a) List of Email listeners and current status
b) List of File listeners and current status
c) List of Application specition specific agents and current status
In your MBean image provided in earlier conversations, I can see a list of Mbeans available in jConsole.
Without accessing jConsole, please tell me where can i get the list of MBeans and supported operations and description.If I have the MBean names and supported operations, I can pass these values like below and get the required details.
Thanks
-Sudheer CH
Pegasystems
US
>>> That would require an API to PRPC/Pega7 to accomplish what you're doing. I'm not sure it exists currently
Doesn't the fact that SMA is able to show the information prove that there is an API to accomplish it, and the issue here is one of either determining what that API is that SMA is using, or perhaps an issue of propriety if for some reason Pega does not want the API to be known by application developers ?
Perhaps you can write records into your own table during user login and logout by modifying SSO activity that keeps track of active user count. I don't know of an OTB solution to get an accurate data about live users.
Ultimately from PRPC/Pega7, yes this is definitely doable. But is it practical for a 10,000+ user base to record logins/logouts. This could potentially turn into millions of rows or more daily, and could impact performance if not carefully done. So the solution has to be scalable.
Accenture
IN
You can use pr_perf_stats, pr_daily_usage and pr_hourly_usage table in order to get number of users/requestor logging in Daily/Hourly.
These tables has all the details related to request login and logout information.
By quering pr_hourly_usage you can get a pattern of number of concurrent request logging in a particular hour.
Yes, we know that the API exists in SMA to get the numbers. The question is not if the API exists, but does one exist that can be leveraged to get #'s across all Nodes. The current API assumes a connection to the "selected" node already exists and leverages it and returns the data. What Ray is looking for is a single display (if I understood correctly and waiting confirmation from), for all nodes and their associated #'s in some simple to read display without the need to connect to each node, then click on the Requestor Management link for that node.
For example, if we have two SMA's - one for all our development nodes and one for our production nodes. Each can have one-to-many nodes to connect to. I see the value in having a single SMA'ish URL which displays all the data without having to connect to each one individually. Whether it be for Requestor Management or something else. This is one area of the application that could be enhanced to support "Total System Management" from an admin perspective to address this question. That's what I'm investigating...
-Steve
Current Posting of System Management Application and it's resources (PDF files). https://collaborate.pega.com/discussion/error-while-openning-node-system-management-application
There have been some improvements in SMA for the v7 series to include support of Declarative Page Management, High Availability, Application Based Assembly Cache Management and other features, but nothing from a Cluster or Server Farm perspective.
Being late in the day and PegaWORLD 2015 next week, resources are engaged currently. I suspect I'll have something more definitive next week. Jon's post does address the logoff's and other security details and one could override those rules. This may work fine for a cluster of nodes connecting to a single database, but a Server Farm of multiple servers with a cluster of nodes connecting to multiple databases will be more involved. More to follow next week...
Hi Ray,
As promised, I did get in touch with the group responsible for this area and API's. That said, there are no current options in SMA, PDC or AES to get details from multiple clusters with multiple server/nodes in one API. AES provides the closest features you are looking for, but not 100%. There are plans in a near future release of AES to provide this level of detail to enable a true multi-cluster node management application. There were many techniques offered in this posting and each provide an excellent feature and/or API to achieve numbers for a single cluster of servers - short of creating a Java App to get what you want ultimately Ray (based on your reply to me).
My advice right now would be to work towards upgrading environments to the latest version of Pega7 (7.1ML8) and be one step closer to seeing this option coming soon. I know I look forward to it, as do many others. Good luck!
BNY Mellon
US
re: "and the issue here is one of either determining what that API is that SMA is using..."
Uhh, see my response from 12:30pm above. API supplied.
Pegasystems
US
Assuming Jon's reference to pega.getConnectionsList(clipboardpage) somehow targets the list from a particular node (is the node specification buried in the acquisition of the "pega" object ?), then I would envision a solution to Ray's original request to look something like this sketch:
loop over all the node names {
set connection-list = pega.getConnectionsList . . . ;
set node-name = name of node we're looking at;
set num-connections = 0;
loop over connection-list {
if (this connection is of interest)
increment num-connections;
}
output "For node " + node-name + " the number of connections is " + num-connections;
}
Pegasystems Inc.
IN
Pegasystems Inc.
IN
Accepted Solution
Accenture Federal
US
All,
I have resolved my inquiry. With jconsole and a software called twiddle.sh i have been able to communicate with the jboss instances on the back end, then i pass this information into the local monitoring agent for alerting.
#! /bin/bash
PEGA_ACTIVE_SESSION=$($TWIDDLE --user=$JBOSS_USER --password=$JBOSS_PASS -s localhost get "jboss.web:type=Manager,host=localhost,path=/prweb" ActiveSessions | cut -d'=' -f2)
echo "$PEGA_ACTIVE_SESSION"
This is only a snip-it of the script but it should produce the raw number of ActiveSessions.
Thank you all for your responses.


