Discussion
Pegasystems Inc.
JP
Last activity: 7 Dec 2023 11:18 EST
How to create a large amount of data for load testing
Hi,
As a system integrator, it is the vendor's responsibility to ensure application performs well in terms of responsiveness and stability under high load. The load testing is the key to successful Go-Live. You may need a large amount of records to measure how long it takes for system to respond. In this article, I will share a couple of methods to accomplish this task.
1. Data instances
If you want to create a large amount of data instances for non-Blob table in CustomerDATA schema, you also have other alternatives than Activity approach. A series of activity steps for persistence (i.e. Page-New, Obj-Save, Commit, etc) cost additional overhead time on top of primitive SQL. Activity also involves History insertion, which may not be required for performance testing. Activity is fine, but if you need to save time, you can directly insert data into the table by DML from DBMS. For PostgreSQL, use COPY over INSERT for better performance. PostgreSQL also has a couple of more approaches, but COPY is the most common method of performing a bulk insert and it is easy to use. For Oracle, Direct path load option in SQL*Loader is faster than Conventional path load as it writes the data blocks directly to the database files bypassing the buffer cache. Discuss with DBA the most suitable data load strategies for your project.
2. Work instances
If you want to create a large amount of work instances, work table always has a Blob column and insertion must be done thru Pega tool, not DBMS directly. The first choice is Activity, since it is handy. However, if Activity approach is't fast enough for you, consider DataFlow approach. In this post, I will share Activity approach only.
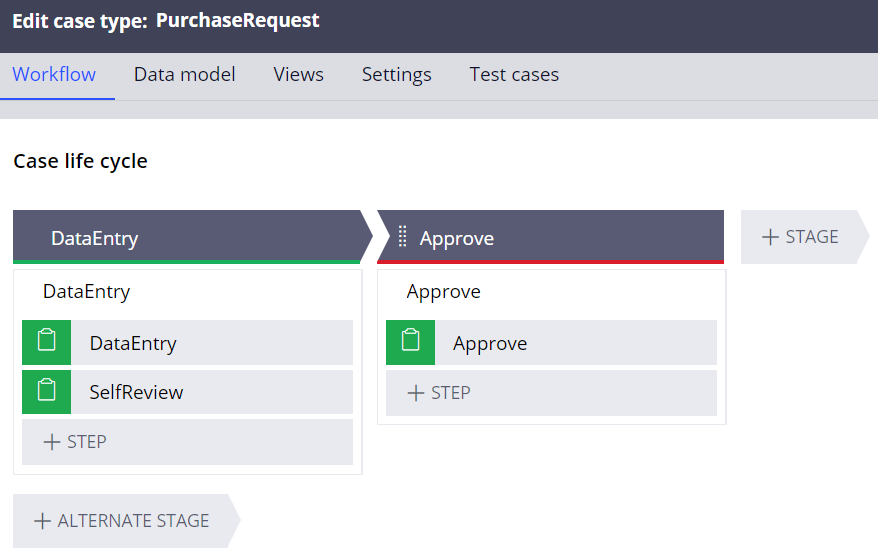
For sample scenario, I have defined a simple "PurchaseRequest" case type that has two stages, "DataEntry" and "Approve", shown as below. We want to create a large amount of work objects that are in the last Approve stage.
- Case life cycle

- DataEntry_Flow
I have included two steps - "DataEntry" and "SelfReview".

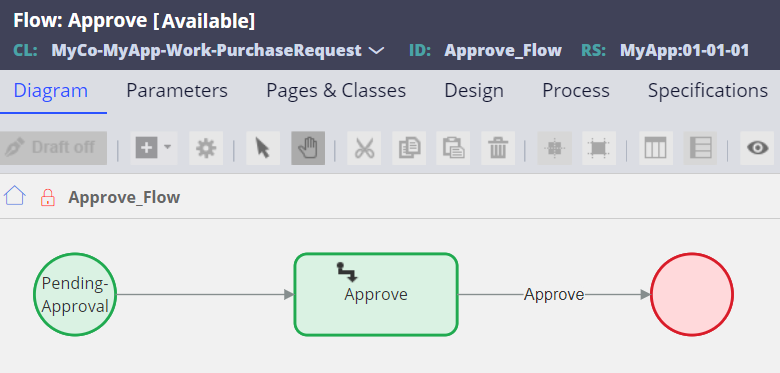
- Approve_Flow
I have included one step - "Approve".

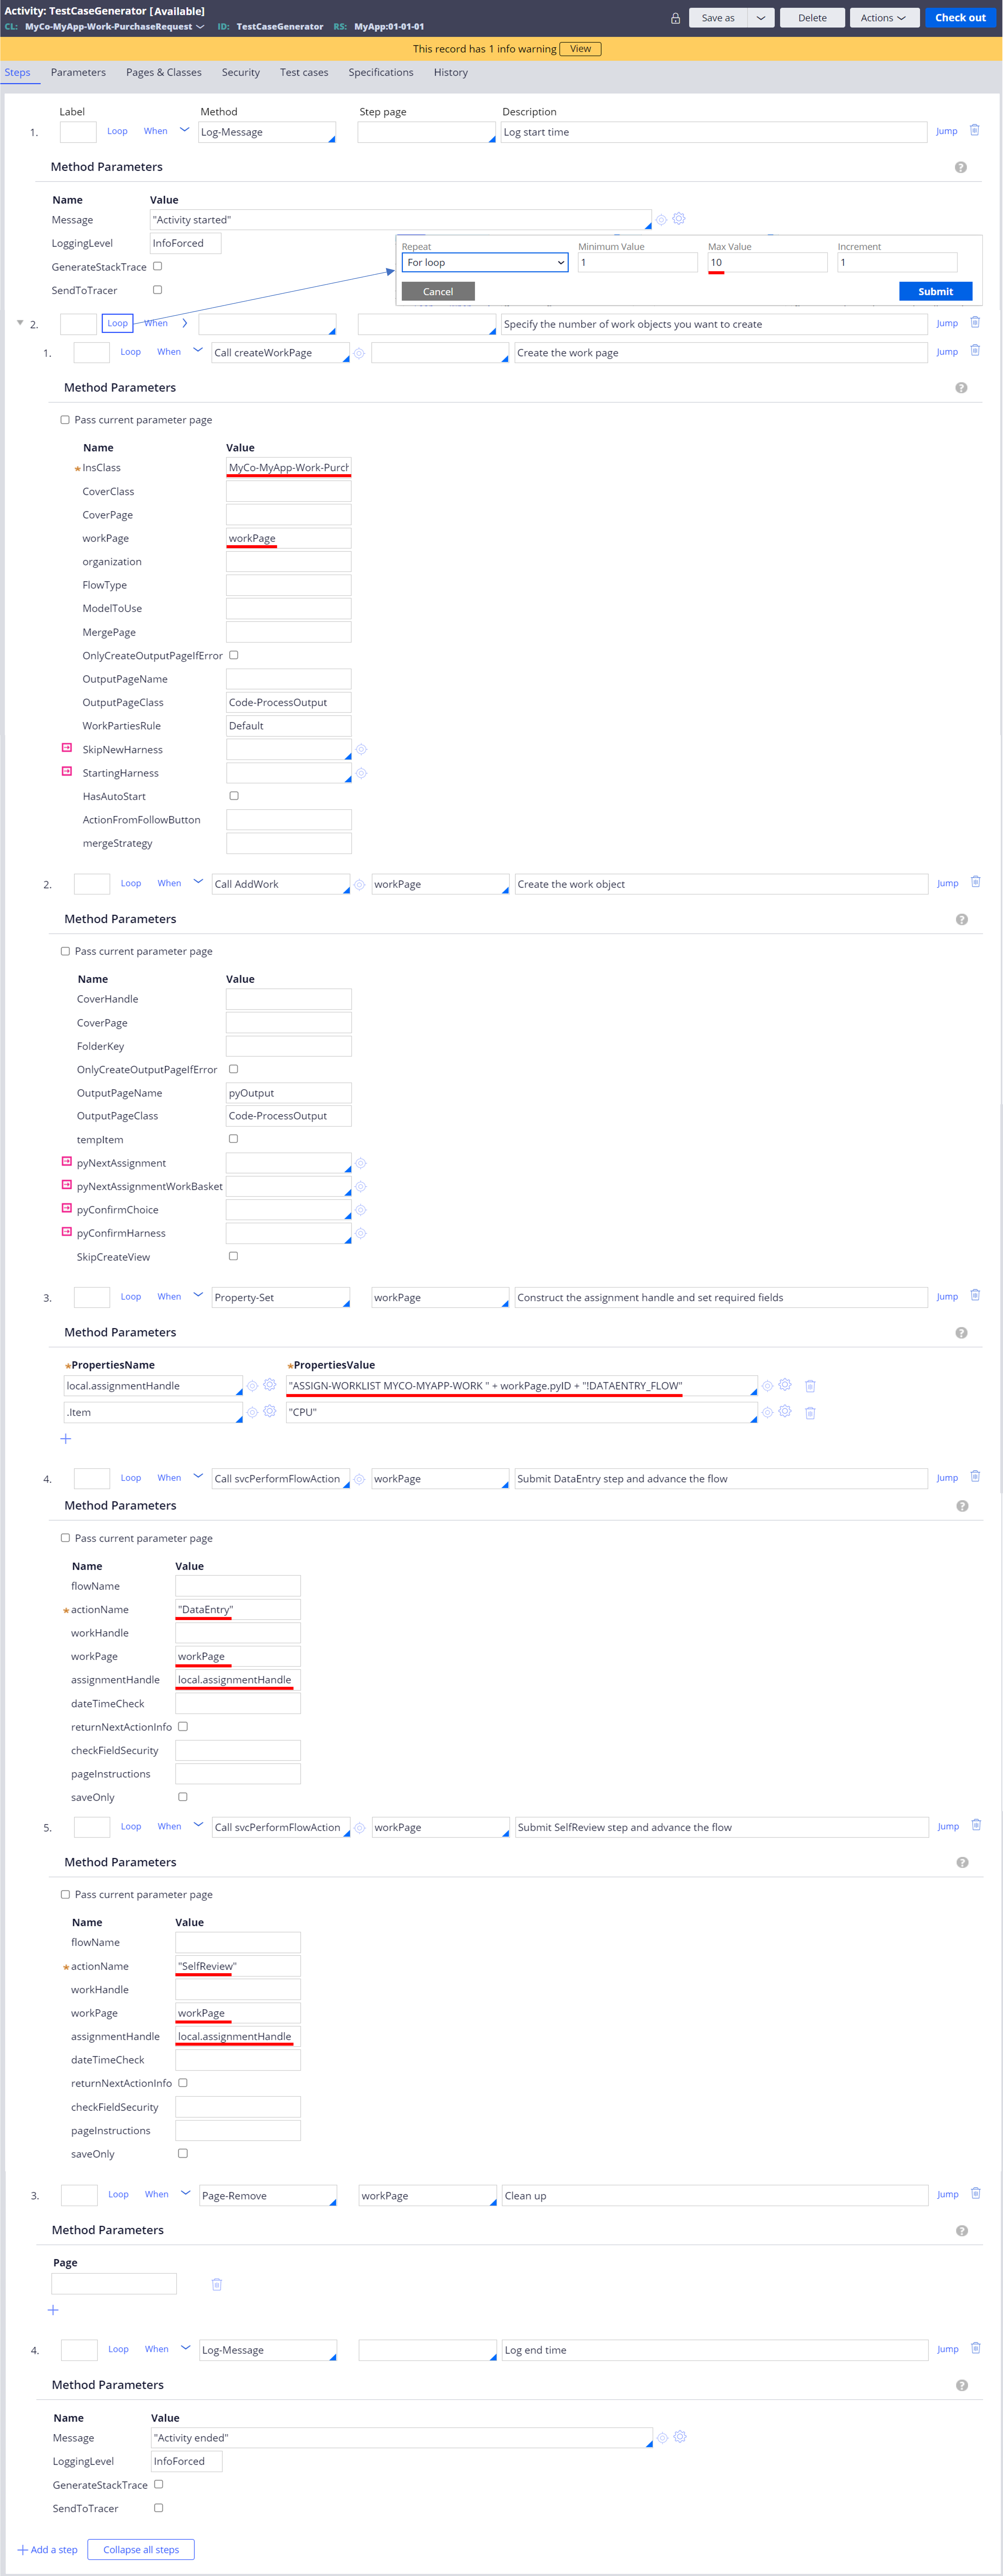
Now, create an activity. Here is the sample code.
[Pages & Classes]

[Parameters]

[Steps]

- Notes
1. There are many other ways to create a work object other than createWorkPage + AddWork Process APIs (ex. svcAddWorkObject, createWorkProcess, NewWork, StartNewFlow, pxCreateTopCase, etc). You can use your preferred one.
2. In this example, I used svcPerformFlowAction Process API. This is the same effect as clicking Submit button from UI. Every submission work object is committed, and it is pretty costly. If you need to submit many times to reach the target shape, it will take a lot of time. To save time, you can also simply set required properties and save the work object once. For example, if you need work objects to be in a certain stage for load testing, you can use pxChangeStage to skip all unnecessary stages and steps. Although data stored in pyWorkPage may not be exactly the same as entries from UI, it is up to how realistic data you need for the load testing.
3. If you don't use svcPerformFlowAction, you should commit by yourself. Commit method gives you Severe Warning, so use Process API such as commitWithErrorHandling or WorkCommit instead.
4. FYI - when I created 100,000 work objects using above activity on my local machine, it took 60 minutes and 5 seconds. My local machine spec is as follows:
* CPU: Intel® Core™ i7-265U CPU @ 1800Mhz, 10 Core(s), 12 Logical Processor(s)
* RAM: 24GB (Heap size: 16GB)
5. If you run into "Unable to synchronize on requestor... within 120 seconds" error, see below post for how to suppress it.
https://support.pega.com/discussion/how-avoid-unable-synchronize-requestor-timeout-error
6. After you run the activity, when 10 minutes pass, system will write "PEGA0019 alert: Long-running requestor detected" into PegaRULES-ALERT.log file. This is because the master agent tracks a busy requestor for a certain period of time, and its default is 600 seconds (10 minutes). When this PEGA0019 alert occurs for a certain number of times (by default, 3 times), then master agent will stop generating alerts any more and write Thread Dump into PegaRULES.log file. This means, Thread Dump is generated when 30mins pass (600 seconds * 3 times = 1,800 seconds). I have attached the example message below.
* PegaRULES-ALERT.log (PEGA0019)
PEGA0019*Long running interaction detected.
* PegaRULES.log
2023-11-27 18:33:16,909 [LES ManagementDaemon] [  STANDARD] [                    ] [                    ] (l.context.ManagementDaemonImpl) WARN     - Long running request detected for requestor HKTM0YUFUCUYPKUIFR8WKFDIPCULW2NETA on java thread http-nio-8080-exec-1 for approximately 1841 seconds -- requesting thread dump.
2023-11-27 18:33:17,952 [LES ManagementDaemon] [  STANDARD] [                    ] [                    ] (.timers.EnvironmentDiagnostics) INFO     - --- Thread Dump Starts ---
Full Java thread dump with locks info
"RMI RenewClean-[ Proprietary information hidden:62905]" Id=2085 in TIMED_WAITING on lock=java.lang.ref.ReferenceQueue$Lock@10a8aacb
BlockedCount : 0, BlockedTime : -1, WaitedCount : 2, WaitedTime : -1
    at java.lang.Object.wait(Native Method)
    at java.lang.ref.ReferenceQueue.remove(ReferenceQueue.java:144)
    at sun.rmi.transport.DGCClient$EndpointEntry$RenewCleanThread.run(DGCClient.java:563)
    at java.lang.Thread.run(Thread.java:750)

    Locked synchronizers: count = 0
...
Even if these log messages are printed, your activity should continue. However, if you don't want to see this massive messages, you can suppress it by creating a new Dynamic System Settings instance and set the value to false.
- Setting Purpose: prconfig/alerts/longrunningrequests/enabled/default
- Owning Ruleset: Pega-Engine

Thanks,
