Question
Last activity: 9 Mar 2019 15:42 EST
PAL tool readings
Been through some articles in PDN, which seem a little confusing to read and understand.
Any tutorials on reading and understanding PAL?
Pegasystems Inc.
IN
The Performance Analyzer (PAL) provides a view to all the performance statistics that Pega Platform captures. You can use PAL to understand the system resources consumed by processing a single requestor session.
PAL is available on the Performance landing page (Designer Studio>System>Performance) or from the Performance tool in the toolbar.
Measuring performance
The first step to measuring your application performance is to take measurements. You start by clicking "Reset Data" to clear any data in the tool. Since the system is constantly monitoring performance,you are eliminating any previously recorded entries from your results by resetting data. You have two options for adding a reading: "Add Reading" and "Add Reading with Clipboard Size". The only difference between the two readings is the addition of the clipboard size,which takes extra time to calculate. When adding a reading,the best practice is to define points that identify what occurred during that reading. For example,use one reading per flow action or screen render,depending on what process you are measuring. Click Save Data to download the results to an Excel file.
Analyze performance data
The INIT row shows the totals when this Performance display first appeared. Each reading added is shown as a DELTA — this indicates the change from a previous reading. The FULL reading is the total sum of all the statistics from the last time the data was reset.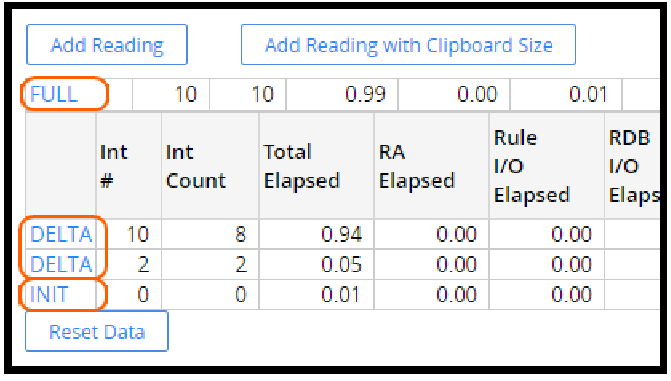
In the readings displayed,you can see the top delta has a reading that shows 1.61 for RA Elapsed. All values are in seconds. RAE lapsed represents the time spent in rule assembly. These results can skew performance readings as rule assembly,also known as first use assembly or FUA, is expensive but only occurs once. This is evidenced by the results you see here. The total elapsed time was 2.82s, and 1.61s of that time was spent in rule assembly. If you did not have the additional 1.61s, the total time would be less than half the measured number. FUA also affects the other readings such as the total rules executed,the reads from the database,and various I/O counts.
To obtain results not affected by FUA, you should run through the process once to ensure all rules have been assembled before taking any measurements. That was not done here in order to demonstrate the impact this has on performance readings. Clicking INIT,DELTA,or FULL displays more details about the reading. Many different results are available to you for analyzing the performance.