Closed
How to interpret Warning Summary
Hi,
I am having a difficulty with how to interpret Warning Summary in Guardrails landing page. You can reach this screen from Dev Studio - Application > Quality > Guardrails.
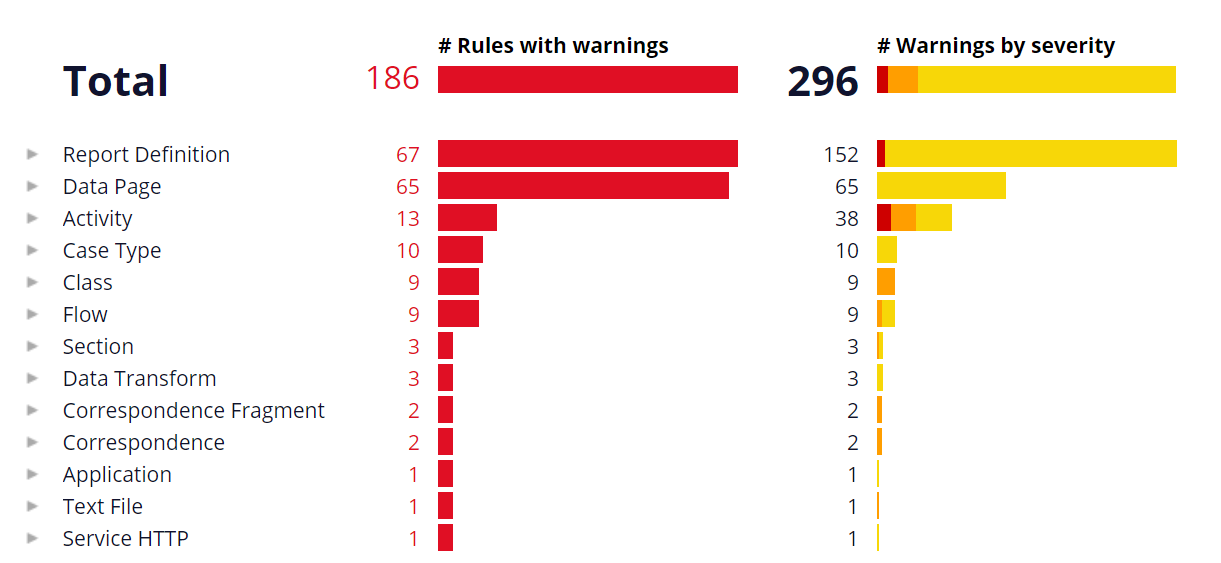
For example, above is the screenshot from my local machine. I see 186 for # of rules with warnings (left side) and 296 for # Warnings by severity (right side). At first glance, I would interpret this way - out of 186 rules that have warnings, what severity each rule has. However, right side is even more than left side. When I hover, 296 is broken down to 11 severe warnings, 30 moderate warnings, and 255 informational warnings. So I do not see any connection between any of these number and left side 186. Can anyone tell me how to interpret these two numbers?
Thanks,
***Edited by Moderator: Pooja Gadige to add platform capability tag***
To see attachments, please log in.
Posted: 4 years ago
Digital Fast Forward
Digital Fast Forward
US
@CloeW938The answer is that some rules have multiple warnings associated with them, so in your case there are 186 rules with warnings in your application, but among those 186 rules, there are 296 warnings total. For your data page rules, there are 65 rules with warnings and 65 total warnings, so one warning per rule. But for your report definition rules, there are 67 rules with warnings with 152 warnings between them, so it is safe to assume that multiple of your individual report definition rules have multiple warnings, which in my experience, seems to be fairly common with report definitions.
This Knowledgebase article has a lot of good information related to guardrails: https://community.pega.com/knowledgebase/articles/implementation-methodology-and-dco/guided-development-through-guardrails
Hope this helps!