Applies to Pega Autonomic Event Services 7.1.7 through 7.2
Learn how to troubleshoot Autonomic Event Services, AES 7.1.7 and AES 7.2, connectivity, performance, and reporting problems.
Use the checklist provided in this article to prevent configuration problems.
If you have an AES configuration problem that requires you to submit a support case, use the must-gather list provided in this article to collect the artifacts that GCS needs to resolve your SR.
Symptom 1: Enterprise Health Monitor does not display nodes or clusters
Symptom 2: No data is returned for agents, requestors, and other node elements
Symptom 3: Some data is not pushed correctly from monitored nodes
Symptom 4: AES nightly tasks are not removing expired data
Symptom 5: Too many exceptions and alerts in the databse tables
Symptom 6: The protocol changed to HTTPS and now some data is missing
Symptom 7: Data returned from a request is data from a different node
Run AES agents on all nodes in your AES server cluster
Checklist for avoiding AES 7.1.7 and AES 7.2 configuration problems
Must-Gather artifacts for a Support Request (SR)
Symptom 1: Enterprise Health Monitor does not display nodes or clusters
When the AES Enterprise Health Monitor does not display the nodes or clusters being monitored, any one or more of the following conditions might cause this symptom:
- Operator access fails: The operator does not have access to the AES nodes or clusters being monitored.
- No health messages are being sent to the AES server.
- The endpoint specified in the monitored nodes for the Predictive Diagnostic Cloud (PDC) URL is incorrect.
- SOAP messages sent from the monitored nodes do not reach the AES server.
Problem: Operator access fails
Frequently, the Enterprise Health Monitor in the AES Manager portal does not display any clusters or nodes. This can occur when the operator ID in use has not been given access to the cluster or node.
Solution: Grant operator access
To grant the operator access to the cluster or node, follow these steps:
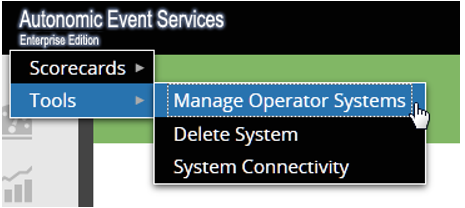
- From the AES Tools menu, click Manage Operator Systems.
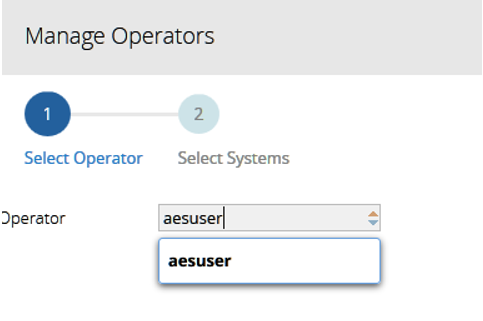
- In the Manage Operators screen, Select Operator, select the name of the operator from the list:
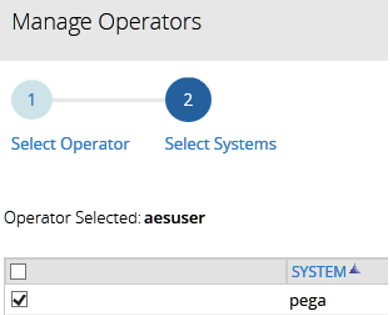
- In the Manage Operators screen, Select Systems, select the name of the system for the operator you specified in Step 2.
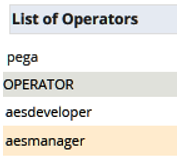
- To verify the results of the previous steps, go to the AES Enterprise Administration Tasks, the Management view, and click Display Operators By System.

- Click the name of the system that you specified in Step 3 to verify that operator who you specified in Step 2 has access to the system of the monitored nodes or clusters.
Problem: No health messages sent to the AES server
When no health messages are being sent to the AES server, either one or both of the following conditions might be the cause of this problem:
- Legacy Pega Platform version 6.x information for sending health messages to the AES server in the prlogging.xml and prconfig.xml files causes inconsistency.
- The PegaAESREMOTE agent is not running on the monitored node.
Solution: Remove Pega Platform version 6.x legacy information from the prconfig.xml files
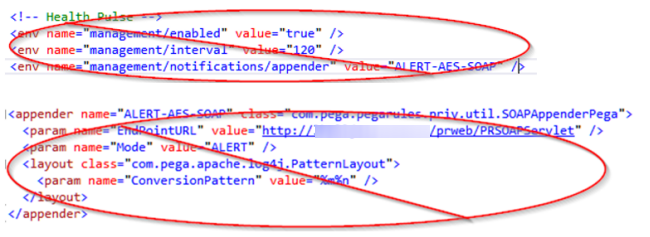
Make sure that the prconfig.xml and prlogging.xml files specify information that is consistent with monitored node. PRPC 6.x releases have no dynamic appenders. AES 7.x will monitor PRPC 6.x nodes. Be sure to remove PRPC 6.x information because a guardrail report is not provided for this issue.
When the prconfig.xml file specifies legacy information used by earlier AES versions, remove that legacy information from both the prconfig.xml file and the prlogging.xml file.
This example image illustrates legacy information from earlier AES versions that is still specified in the prconfig.xml and prlogging.xml files that you need to remove.
Solution: Make sure that all PegaAESRemote agents are running on the monitored node
When the PegaAESRemote agent is not running on the monitored node, connect to the System Management Console (SMC) for the monitored node. Make sure that all of the PegaAESRemote agents are running as shown in the following example.

Problem: The endpoint specified on the monitored nodes for the Predictive Diagnostic Cloud (PDC) URL is incorrect
Solution: Specify the correct PDC endpoint URL
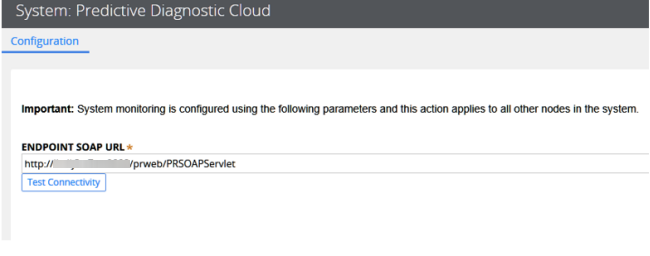
If you suspect that the PDC URL endpoint for the monitored nodes is incorrect, check the PDC system settings from the Designer Studio landing page.
The current way to connect to the AES server is to use the dynamically built-in appenders that are generated in all Pega 7 Platform systems. The PDC URL is sufficient to make the proper connections for Health, Exception, and Alert data.
- From the Designer Studio landing page, click System > Settings > Predictive Diagnostic Cloud.
- On the System: Predictive Diagnostic Cloud Configuration screen, type the correct URL in the Endpoint SOAP URL field.
Problem: SOAP messages from monitored nodes do not reach the AES server
When SOAP messages sent from monitored nodes do not reach the AES server, some infrastructure problem in your deployment is probably the cause.
Solution: Refer to Pega Documentation
See SA-7393 SOAP errors on AES-monitored node.
See SA-6665 Multiple nodes shown as unavailable in AES Health Dashboard.
See also Managing clusters by using Autonomic Event Services (AES).
Make sure that the monitored node is providing the correct information to the AES server’s application server so that authentication of the SOAP service can take place. This is done by using the AES Enterprise Administration Tasks, Manage SOAP authentication. If you see HTTP 401 errors in the log, you might need to use the AESRemoteUser Authentication Profile depending on your AES version and patch level.
See SA-13972 AES Manager portal 401 error with SOAP Authentication and SA-12131 AES throwing 401 errors while communicating with monitored nodes.
Make sure that if you are using SSL that the appropriate security certificates are installed.
See SA-25004 AES not able to monitor nodes running on JBOSS.
Symptom 2: No data is returned for agents, requestors, and other node elements
Frequently no data is returned for agents, requestors, and other node elements when there is a problem communicating to the monitored node. This can happen when one or more of the following conditions exist. This is not an exhaustive list:
- The node URL was not automatically discovered on startup.
- The application server requires Secure Sockets Layer (SSL) communication protocol.
- The application server requires authentication for incoming traffic.
Problem: The node URL is not automatically discovered on startup
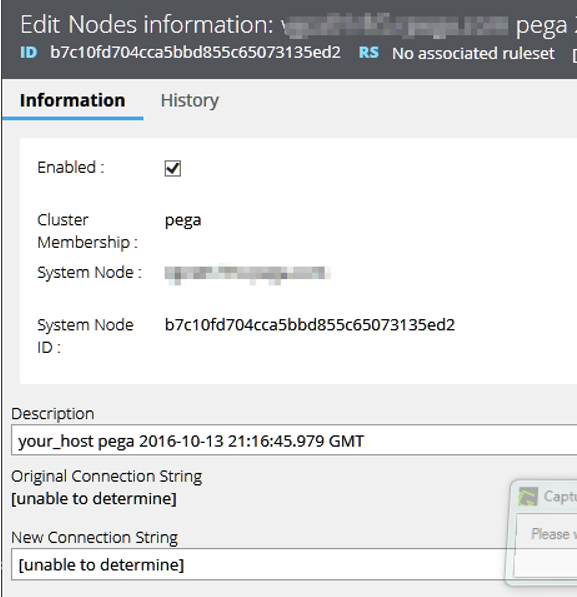
When a new connection string cannot be determined by the system for an enabled node, you need to specify the URL.
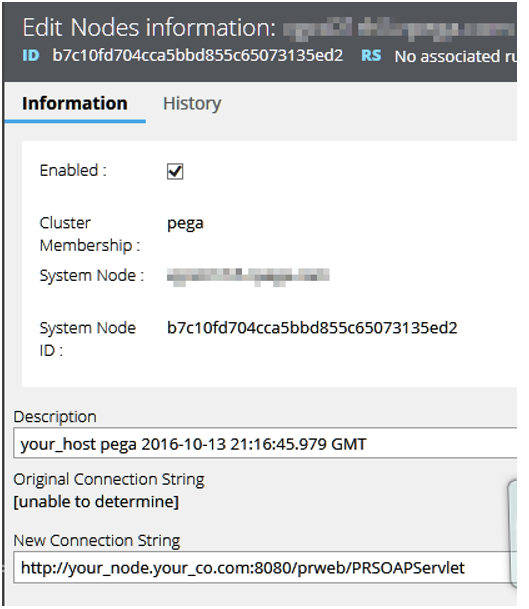
Solution: Edit the Node Information to specify the New Connection String
The following image shows an example in which the Node Information New Connection String value is [unable to determine].
Edit the Node Information field New Connection String to specify the correct URL as shown in the following image.
Problem: The application server requires Secure Sockets Layer (SSL) communication protocol
When the application server requires SSL, the application server log should indicate that there is a handshake error.
Solution: Security certificates are installed
If you are using SSL, make sure that that the appropriate security certificates are installed.
See SA-25004 AES not able to monitor nodes running on JBOSS.
Diagnostic: Specify the JVM argument for the SSL handshake
If it is not clear why the handshake error is occurring you can use the following JVM argument:
-Djavax.net.debug=ssl:handshake
This can also be specified in several different ways within your application server. Check with your infrastructure team regarding the certificates and configuring the diagnostic.
Problem: The application server requires authentication for incoming traffic
Solution: Check the authentication settings on the application server
Make sure that the monitored node is providing the correct information to the AES server’s application server so that authentication of the SOAP service can take place. Do this by using AES Enterprise Administration Tasks, Manage SOAP Authentication. If you see HTTP 401 errors in the log, you might need to use the AESRemoteUser Authentication Profile depending on your AES version and patch level.
Refer to the following Pega Platform version 7.2.2. Help topic and archived support articles:
About Authentication Profile data instances
SA-13972 AES Manager portal 401 error with SOAP Authentication
SA-12131 AES throwing 401 errors while communicating with monitored nodes
Symptom 3: Some data is not pushed correctly from monitored nodes
Problem: Monitored node is not set to PUSH
Data not pushed correctly from monitored nodes can be related to Symptom 1 Problem: No health messages are being sent to the AES server. See the solutions for that problem.
This symptom can also be related to Symptom 6: The protocol changed to HTTPS and now some data is missing. See the solution for that symptom.
If these problems are not the root cause, the DSS for the monitored node might not be set to 'push'.
Solution: Check the DSS values on the monitored node for Value = PUSH
In addition to trying the solutions for Symptom 1 and Symptom 6, make sure that the proper DSS values are set on the monitored node to make use of the ‘push’.

Symptom 4: AES nightly tasks are not removing expired data
Problem: AES agents are not running
The most frequent cause of AES nightly tasks not removing expired data is that the AES agents are not running or have not run in the past.
Solution: Check your set up of AES Agent Management
Review the rest of this article to verify that you have set up AES Agent Management correctly.
Symptom 5: Too many exceptions and alerts in the database tables
If you are monitoring a significant number of nodes, depending on your operating environment, it is possible that even with the AES Agents running successfully, the system still has too many alerts, exceptions, and related work items in play for generating reports and email subscriptions in a timely manner.
Problem: Retention period is too long
A lengthy retention period for alerts, exceptions, and related work can be the root cause of excessive exceptions and alerts in database tables.
Solution: Change AES System Settings for the retention period
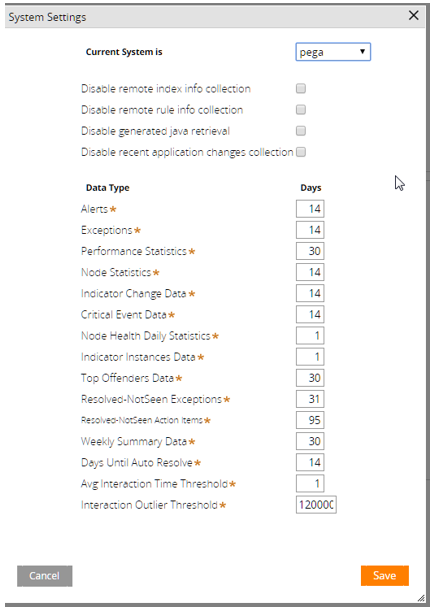
To resolve excessive exceptions and alerts in database tables, reduce the retention period in the AES Settings:
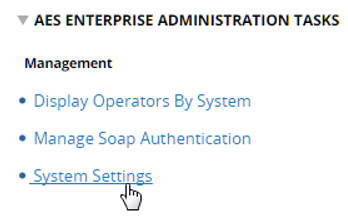
- From AES Enterprise Administration Tasks, Management screen, click System Settings.
- In System Settings, for each Data Type listed, reduce the number of Days specified for the retention period.
- Modify the following pseudo SQL to see if data is being correctly trimmed in the alert and exception table. Modify the pseudo SQL as required by your database management system.
Select count(*) from <data-schema>.pegaam_alerts where pxcreatedatetime < ‘fourteen-days-ago’;

Select count(*) from <data-schema>.pegaam_exceptions where pxcreatedatetime < ‘fourteen-days-ago’; - If these statements return a value much greater than zero (0), you need to delete the data manually.
- If you wish to preserve the data, then you should check the command timeout settings in your application server for the PegaRULES data source. Consider increasing or shutting off that timeout.
- Another local change would be to partition the data by date and use database tools to remove that data from the exception or alert tables.
Symptom 6: The protocol changed to HTTPS and now some data is missing
When the communications protocol changes to Secured Sockets Layer (SSL), the communicating systems must have the appropriate certificates installed.
Problem: SSL certificates missing or not installed correctly
Solution: Install SSL certificates correctly
Because SSL certificate management is outside of the Pega Platform, work with your infrastructure team to make sure that the certificates are installed correctly. The use of these certificates is handled by the application server.
Also try this good diagnostic, applied to the JVM arguments:
javax.net.debug=ssl:handshake
Symptom 7: Data returned from a request is data from a different node
Problem: AES server as load balancer lacks information from requested node
If you have provided the correct URL to the AES server as a load balancer or web plugin URL and you are monitoring many nodes ‘behind’ that IP address, then you have not provided enough information for the AES server to gather specific information from the requested node. Therefore you are getting the details from whichever server is used in accordance with the load balancer algorithm. In this case, specific information can be ‘pushed’ from the monitored node only. The AES server is not able to directly access the monitored node to make queries regarding the requestors or agents.
Solution: Not a supported configuration
These capabilities are not supported in the AES manager portal.
Run AES agents on all nodes in your AES server cluster
Prior to AES 7.1.7, you were most likely to run agents on the AES server using a dispersion approach for clustered deployments because you segmented the AES agents among the nodes of the cluster. With AES 7.1.7 and later releases, this approach is no longer needed and should not be used.
In AES 7.1.7 and later releases, the agents that run on the AES server are designed to make sure that the code runs only on one node at a time. This is controlled by the Dynamic System Setting (DSS) AES/SECURITY/AGENTS/NODEID.
- AES Agents for a clustered environment run on a single node, AESAgentsNode.
- When the node on which AES agents are running stops, some other active node is detected and used for running the AES agents.
Here are the highlights of this new feature:
- Supports running the agents on all nodes for AES 7.1.7 and AES 7.2
- Runs agents on one node only
- Has some fail-over capability
Do not use the old method of segmenting and dispersing the AES agents!
The following section provides a preview demonstration of how this new DSS AES/SECURITY/AGENTS/NODEID works. This information might be useful if your AES server does not seem to be performing its data housekeeping tasks effectively.
Watch for complete information about this product enhancement coming soon in another PDN Article.
How Dynamic System Setting AES/SECURITY/AGENTS/NODEID works
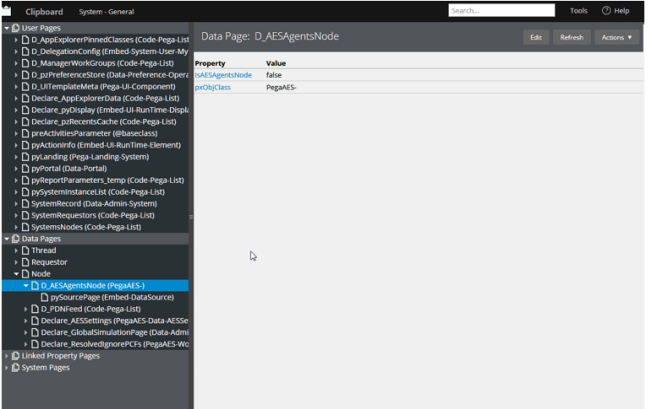
AES 7.1.7 and later releases provide the DSS AES/SECURITY/AGENTS/NODEID and the data page D_AESAgentsNode, which expires every 30 minutes. All agent activities check to see that they are on the right node. The load activity checks System-Status-Nodes to be sure that the owning node has "checked in" and is running system pulse. Then it takes over as the AES agent node if the owning node is no longer running.
The following image shows the DSS AES/SECURITY/AGENTS/NODEID that defines which node is to run the AES server agents.
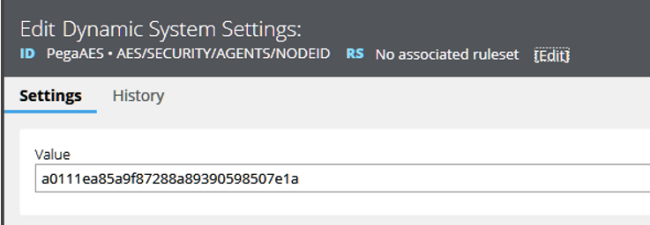
The Value of the current AES Agents Node ID is a0111ea85a9f87288a89390598507e1a.
On this agents node, a0111ea85a9f87288a89390598507e1a, the data page D_AESAgentsNode.isAESAgentsNode is set to true.
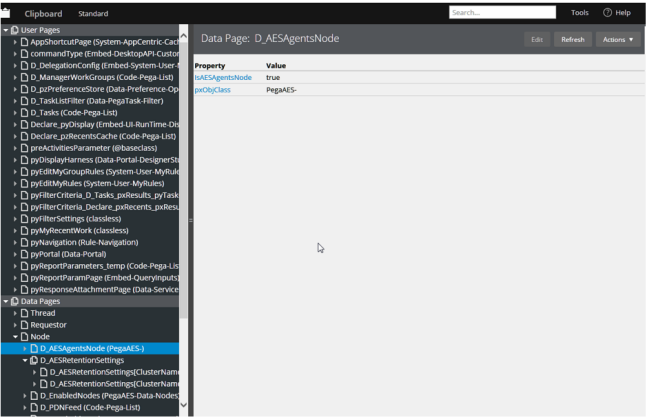
The node level Data Page D_AESAgentsNode has a refresh strategy that inspects the DSS AES/SECURITY/AGENTS/NODEID and the pr_sys_statusnodes table to determine if the designated node is indeed still running.
If the designated agents node (a0111ea85a9f87288a89390598507e1a) is no longer running, the system finds an active node to replace it in the DSS.
Here, on another agents node, 5748a744c98ce4a5d02b843803adb6f6, we see that IsAesAgentsNode is set to false.
Each of the agents’ activities check D_AESAgentsNode.isAESAgentsNode as shown in the following image:
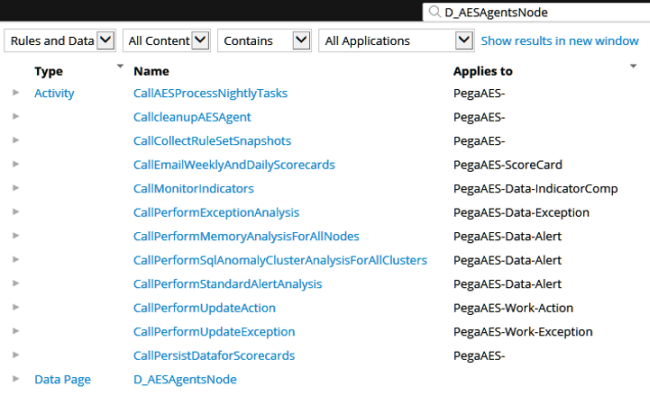
Clicking an Activity in the D_AESAgentsNode list opens the Steps of the Activity as shown in the following image:

Result: All nodes run the agents, but only the AESAgentsNode actually does the work.
This is governed by the DSS, AES/SECURITY/AGENTS/NODEID.

How refresh works after 30-minute timeout or when the AES agents node is no longer running
Here is how the refresh strategy works for the DSS AES/SECURITY/AGENTS/NODEID.
If the node specified in the DSS has a last system DB Cache pulse older than 30 minutes or the current state of the node is not ‘Running’, then another node becomes the AESAgentsNode. See the System-Status-Nodes.SystemNodesDetail All Report, (as determined by the pr_sys_statusnodes table) for node status information.
In the following example you can see that the Pega Proprietary information hidden AES Server node is stopped.

For PYSYSNODEID A0111EA85A9F87288A89390598507E1A, the PYRUNSTATE is now ‘Stopped’.

The remaining node, the one that is Running, now takes over the responsibility for running the AES Server agents. You can see the new node ID in the DSS AES/SECURITY/AGENTS/NODEID,

Now this node runs the agents until it stops and causes the DSS to refresh with a new, running AES agents node.
Checklist for avoiding AES 7.1.7 and AES 7.2 configuration problems
After you set up your AES server, make sure that you have met the following conditions:
- The agents for PegaAESRemote and PegaAES are running.
- The transport layer (SSL/TLS) allows free communication.
- The node definitions specify the correct URLs.
- The AES operator has access to the systems where nodes and clusters are being monitored.
- Authentication is working between the AES server and the monitored nodes and clusters.
Some useful diagnostics
There are many diagnostic tools that you can use. Here is a short list:
On the monitored node
- Logger class com.pega.pegarules.priv.util.SOAPAppenderPega
- Trace the Services with package PegaAESRemote
On the AES server
- Trace Service Soap PegaAES • Events • LogAlert
- Trace Service Soap PegaAES • Events • LogException
On both the monitored node and the AES server
- JVM arg javax.net.debug=ssl:handshake
Getting help
If you have followed the troubleshooting guidance provided in this article and still experience problems with your AES 7.1.7 or AES 7.2 configuration, post your issue to the Pega Support Center. There, Global Client Support (GCS) experts in AES can help you resolve your issue or determine whether you need to submit a support case.
Must-Gather artifacts for a support case
If the GCS engineers responding to you in the Pega Support Center determine that you need to submit a support case for your AES configuration problem, collect the following artifacts before you create your support case. You need to attach these artifacts to the support case before you submit it.
- AES version information
- AES system settings
- Resource > About Pega 7 > System information
- All Pega Log files
- All Application Server log files
- Screen shots that illustrate the problem
- Application hotfixes imported for AES
- Hot Fix Manager > Download scan result
