Applies to Pega Platform™ release 8.5 and later.
Authored by Wolfgang Radl.
Some customers may have existing investments in Business Intelligence and Analytic tools, such as Microsoft PowerBI or Qlik Sense. Users may rely on data and visualization from these systems, and want them on their Pega dashboard instead of switching to a different browser tab. Alternatively, other users may want to use BIX to export data from Pega Platform applications, build reports and visualizations elsewhere, and then embed said reports in Pega Platform applications.
This design pattern describes how to create a control in Pega Platform that contains an embedded report, using an iframe tag.
Creating a new control
- In the header of Dev Studio, click Create > User Interface > Control.
- Select an appropriate label and ruleset.
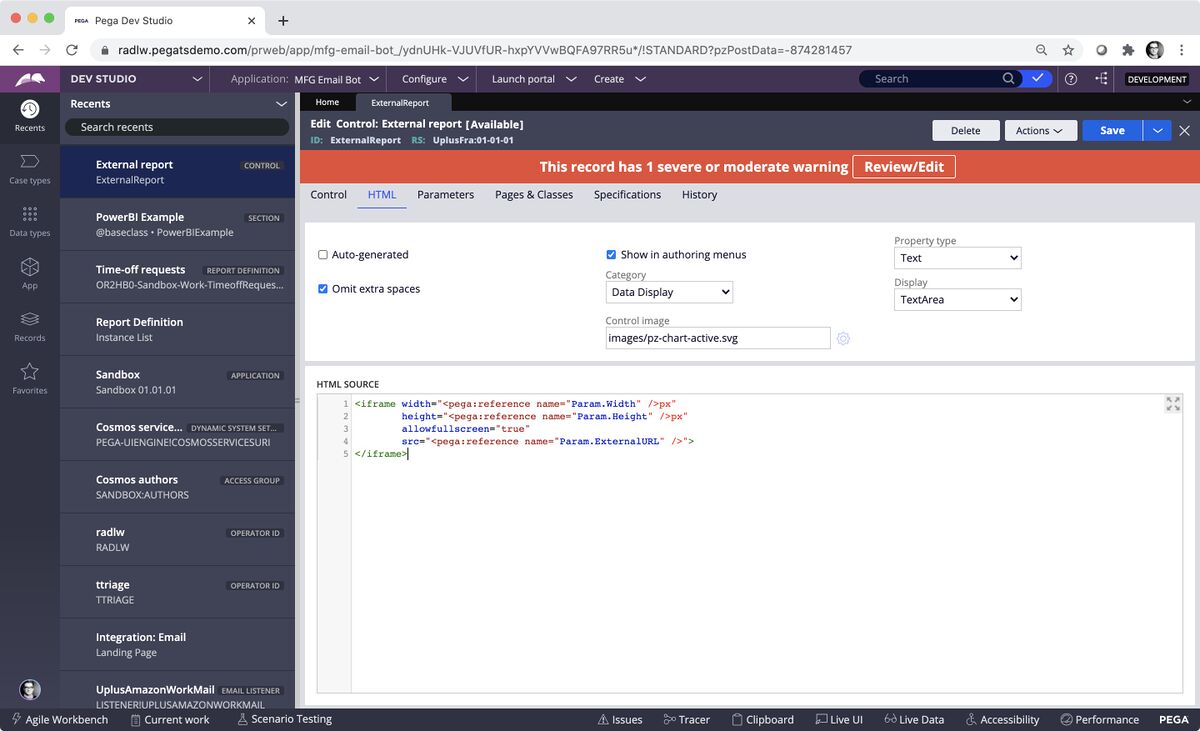
- Clear the Auto-generated check box.
- In the HTML SOURCE field, paste the following HTML:
<iframe width="<pega:reference name="Param.Width" />px"
       height="<pega:reference name="Param.Height" />px"
       allowfullscreen="true"
       src="<pega:reference name="Param.ExternalURL" />">
</iframe>
5. Select the Show in authoring menus check box.
6. In the Category field, select Data Display
7. Optional: In the Control image field, enter the path to a graphic file that you want to use as a control image.
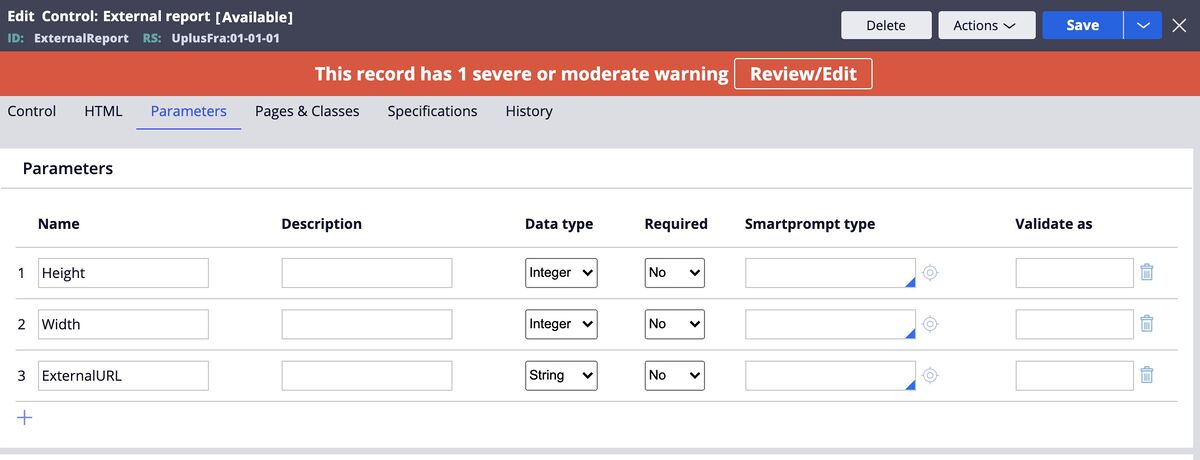
8. On the Parameters tab, create the following three parameters:
- Height, Integer
- Width, Integer
- ExternalURL, String
9. Click Save, and then justify the guardrail warning.
Creating a dashboard widget
- In the header of Dev Studio, click Create > User Interface > Section.
- Select an appropriate label and context.
- Convert the section to a full section - this is required for a dashboard widget.
- Drag and drop the newly created control to your section.
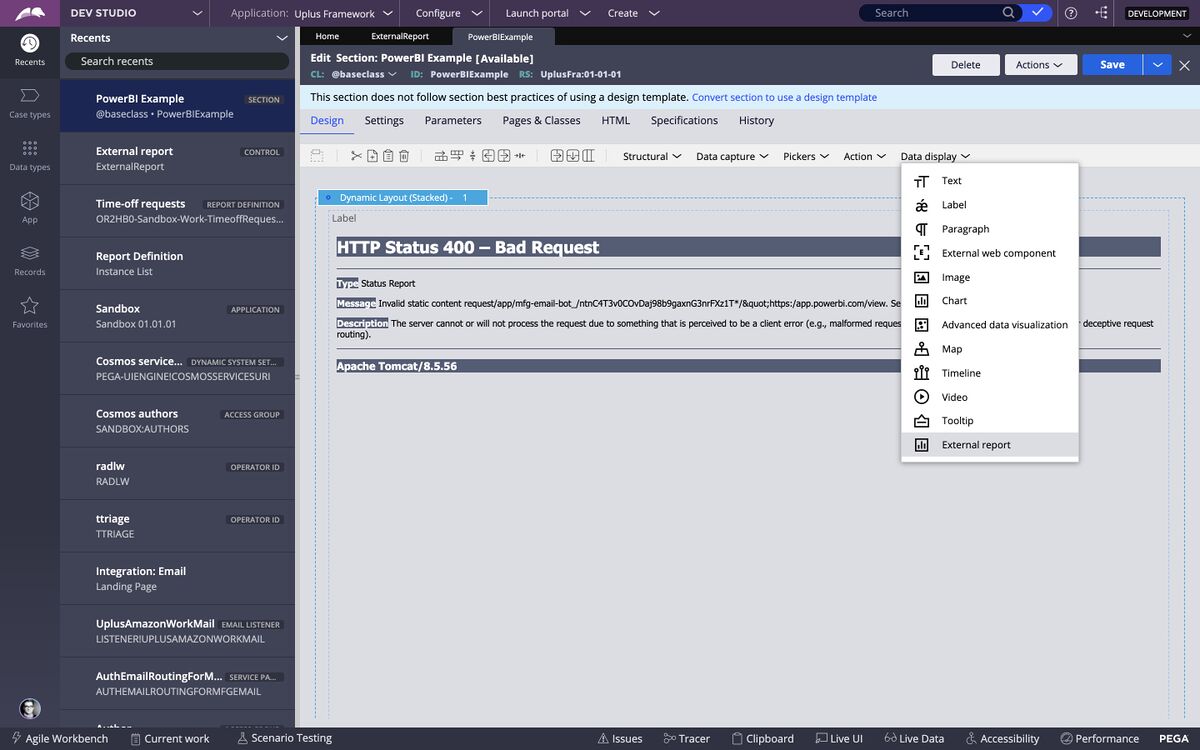
5. Double-click the control to bring up the Cell properties dialog box.
6. Enter the values that you want to use in the Height, Width, and ExternalURL fields.
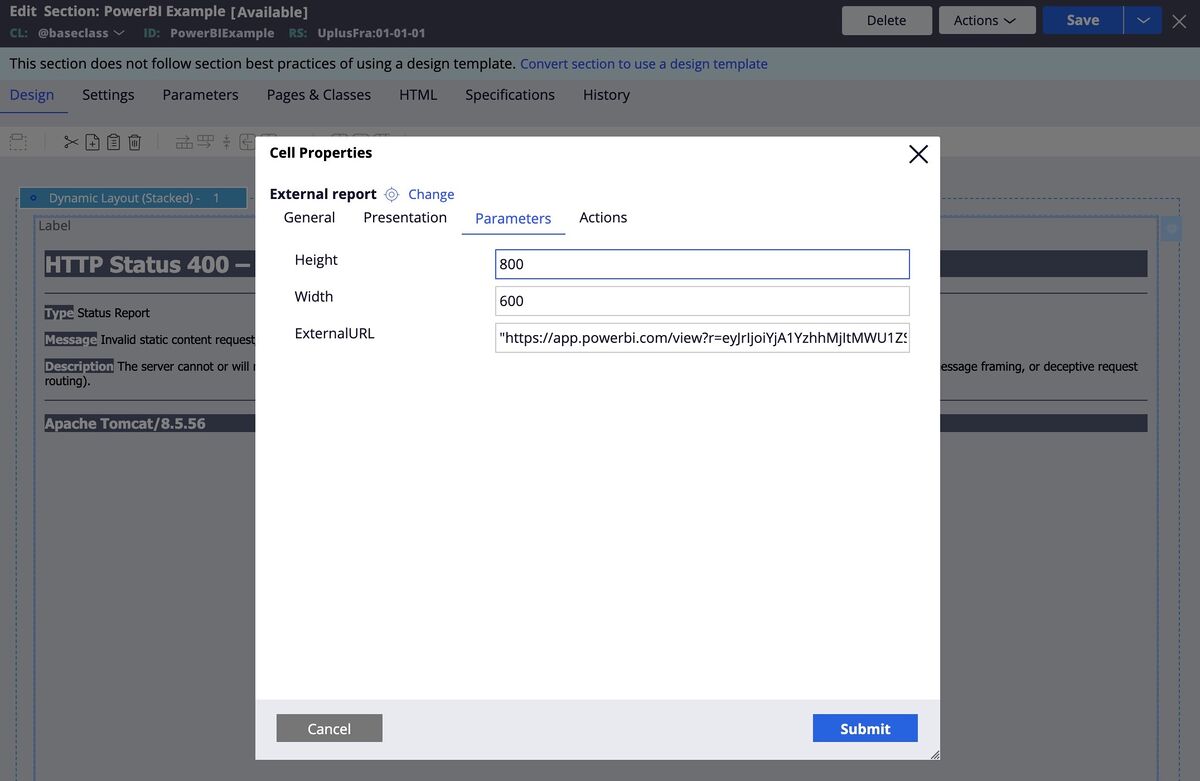
Note: For testing purposes, use the following URL. The double quotation marks are required:
"https://app.powerbi.com/view?r=eyJrIjoiYjA1YzhhMjItMWU1ZS00YmRiLWI3MjUtZDVhN2ZlMzY4NjFlIiwidCI6IjJjOTJmZjI0LWI0MmMtNDgwZC1iNzRkLTY2ZmNlNzZiZDdkYSIsImMiOjl9"
7. Click Submit, and then click the Settings tab.
8. Select Dashboard widget and enter an appropriate name and category, then click Save.
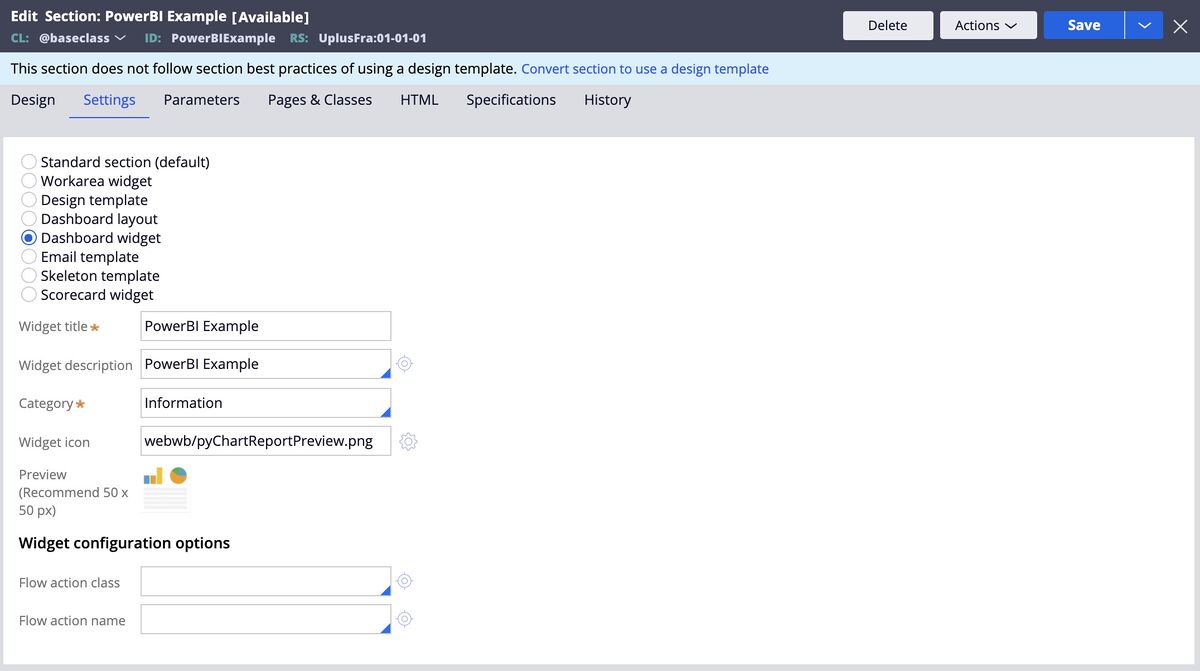
9. Launch your user portal and switch to your dashboard. Click the Settings icon in the upper-right corner to edit the dashboard.
10. Click Add widget(s), select the PowerBI Example widget, and then click Add selected.
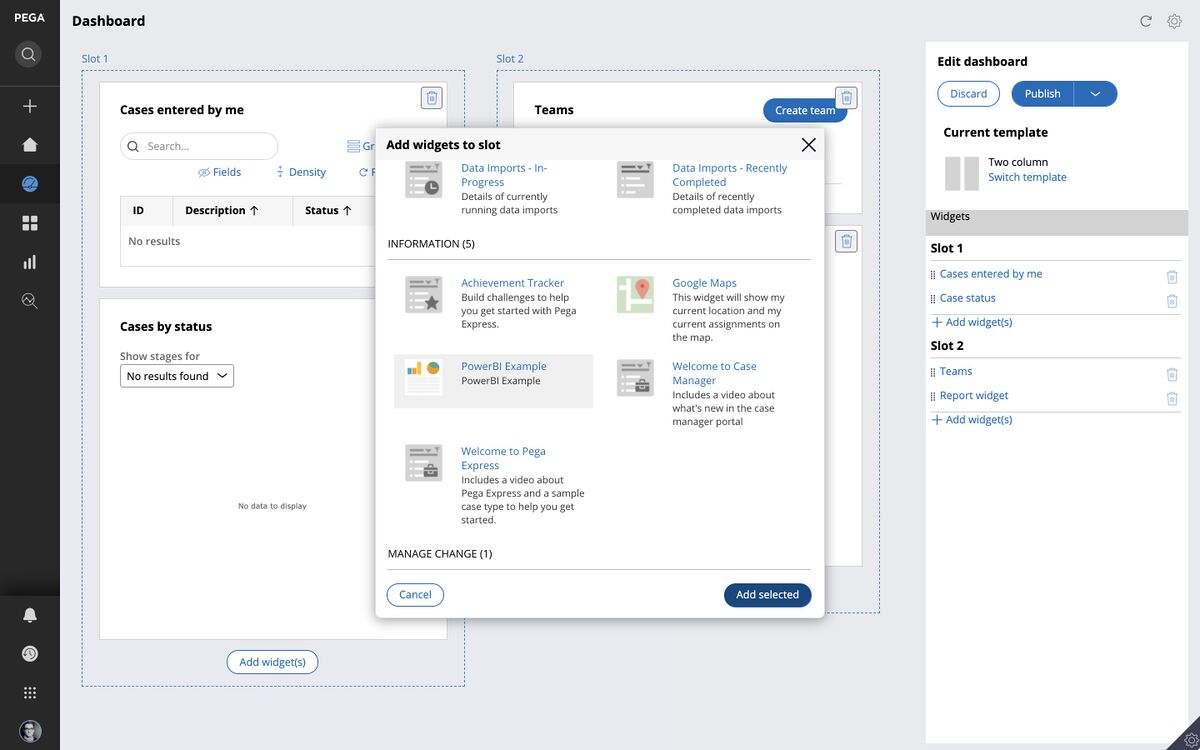
11. To publish the dashboard, click Publish. The widget is now fully interactive.
