how to display count in y axis and percentage in z axis in Pega charts
Hi Team ,
I have to display a report which display count of tasks on Y axis, date on x axis and Percentage of tasks on Bars.
I get all data i.e count, percentage everything from a table. I just need to pull and display it. I dont do any calculation in RD.
Please suggest how to achieve this. PFA IMAGES.
**Moderation Team has archived post**
This post has been archived for educational purposes. Contents and links will no longer be updated. If you have the same/similar question, please write a new post.
BUPA
AU
Hi Pavan,
Try to embed your report definition in a section using Chart Control. This control provided option to set the values for x and y axis also it allows to select bar or other chart parameters.
IN
Hi Swarn,
My report is in a section , but i am able to display only percentage in y axis , but as mentioned in screen shot i shopuld display count of tasks and percentage in y axis and z axis.Can you please share a screen shot of section configuration . As my chart is already embedded in section and i dont find any option to achieve my requirement.
PFA screen shot. I can display only percentage on bars. But i need count of tasks plus percentage as in earlier screen shot.
Pegasystems Inc.
US
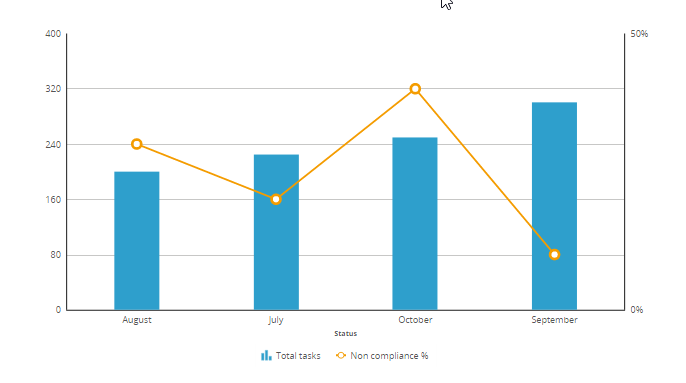
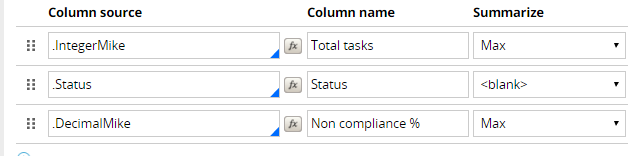
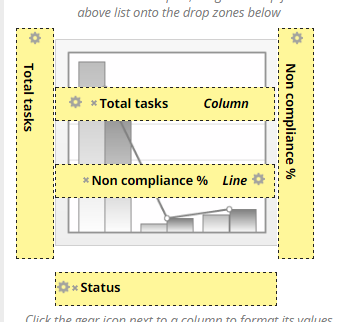
Report definitions don't currently support creating a chart without some calculation being done (one of the columns needs to be summarized). You can work around this by doing a "MAX" or "MIN" on the pre-calculated values to get around it.
I got the following chart with the report configuration below
ING Bank
NL
Hi Mike,
Do you know if there is a way to embed such Dual Y axis graphs into Sections. I used chart control, but I couldn't find Combo chart options at all.
Thanks & Regards,
Vamsi Krishna T