How to define custom series values in a chart
Hi,
I'm trying to create a Pie chart sourced by a report definition:

As you can wonder, I'm calling two sub-reports to summarize the data and present it in the main report.
Based on the data above, I'm unable to create a pie chart in Pega because the pie chart ootb data source requires a Wedges data where I can only select "Open cases" or "Active cases" (not both)... I also tried tweaking the Wedges tab with no luck. With this configuration, I can only get a pie chart with a single color depending if I selected Open cases or Active cases which is not desired.
I wonder how can I do something similar to how a Pie chart in Excel works:
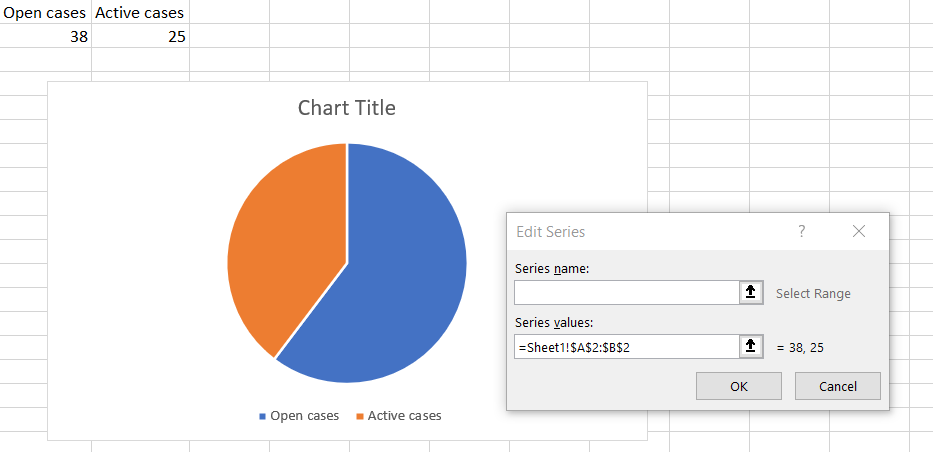
As you can see, I think Excel uses a single series with custom values for that series.
Any thoughts or ideas are welcome :)
Thanks!
-Jose