API Data on Dashboard
Working in a constellation , Have a requirement of displaying data of an open source API in a dashboard on the portal.
for e.g - this is an open api https://disease.sh/v3/covid-19/historical/all?lastdays=all
it has data of total cases on particular date , total deaths on particular date and total recovered cases on particular date
so i want to show that data on the portal in the form of chart or graph , how to do that , can anyone guide here.
also this should be in constellation
Pegasystems Inc.
IN
HashedIN By Deloitte
IN
@Aditi Mehta
I have created connect rest rule through wizard , automatic data and int class get created , field are coming in data object but records are not coming
TATA Consultancy Services
IN
@SoumyaG82 you can load the data to data type then create a insights to show the data in chart.
| Date | Cases | deaths | recovered |
| 22-01-2020 | 557 | 17 | 30 |
HashedIN By Deloitte
IN
@Nadimuthu T i added the data , but only the key field is coming to be populated on UI , why not other fields are not coming? when i try to run d page data is coming , also tried with report definition data is coming , but when trying to be displayed on dashboard only key column is coming not other fields,
what could be the reason
TATA Consultancy Services
IN
@SoumyaG82 Pls share the configuration, thats will help to identify the issue.
HashedIN By Deloitte
IN
This is the API Url i am using
https://disease.sh/v3/covid-19/countries
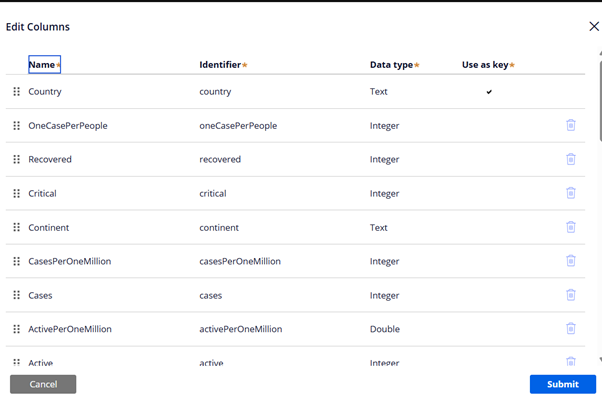
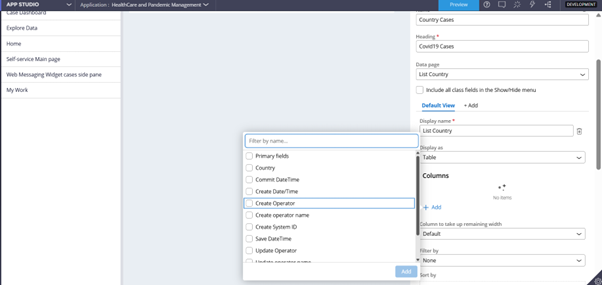
data type --
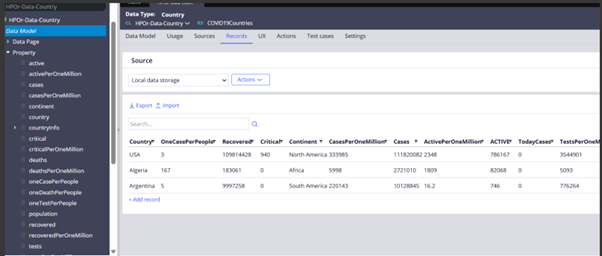
Took country as key
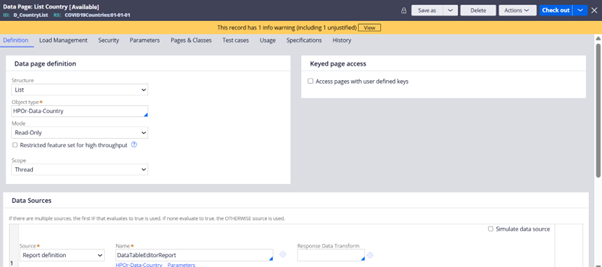
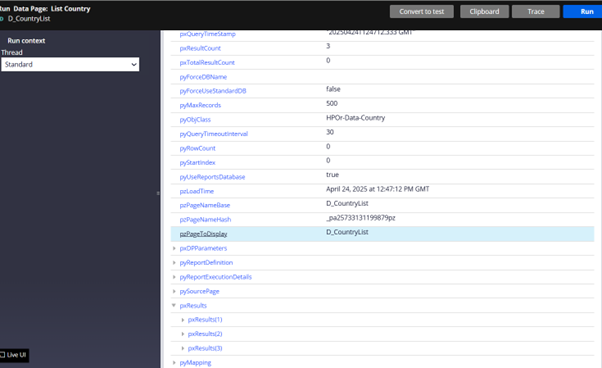
Data page running and RD giving results pxResults as seen in screenshots
But when trying to add these field for dashboard , only country is coming not other fields
TATA Consultancy Services
IN
@SoumyaG82 Please open the property and click mark as relevant Record then log off and login the system and check that.
HashedIN By Deloitte
IN
@Nadimuthu T which property ? country?
TATA Consultancy Services
IN
@SoumyaG82 All the property under that Country data type
HashedIN By Deloitte
IN
@Nadimuthu T Thanks.... this is when we are giving records manually but there is no alternative for coming that API data in records
Pegasystems Inc.
IN
Are you able to locate all your properties while view configuration or still there is an issue?
All the properties in your Data class should be relevant for view authoring irrespective of the source.
@SoumyaG82
Charts or graphs can be added via insights.
For insights we support only the data pages sourced by Report definitions. The data pages sourced for non RDs will appear in the dropdown for insights , but we don't recommend it for production use.
One way to achieve this outcome is to create a mapping data object, for which records are populated from the API. The frequency of updates can depend on your refresh strategy. You can then create a chart insight on this data object.