Remote debugging mobile application on Android
Chrome Developer Tools are great for debugging browser applications. It allows you to inspect and interact with the DOM and styles, analyze scripts for bugs and performance problems, see network traffic and more.
The same set of tools can be used to debug an application that is running on your mobile device both in a mobile browser and in Pega mobile client.
This article describes how to configure your computer, your mobile device and your application in order to do that.
-
Configuring application
This is only needed if you want to debug an application running in Pega mobile client.
If you plan to debug an application running in mobile browser, skip to the next step.
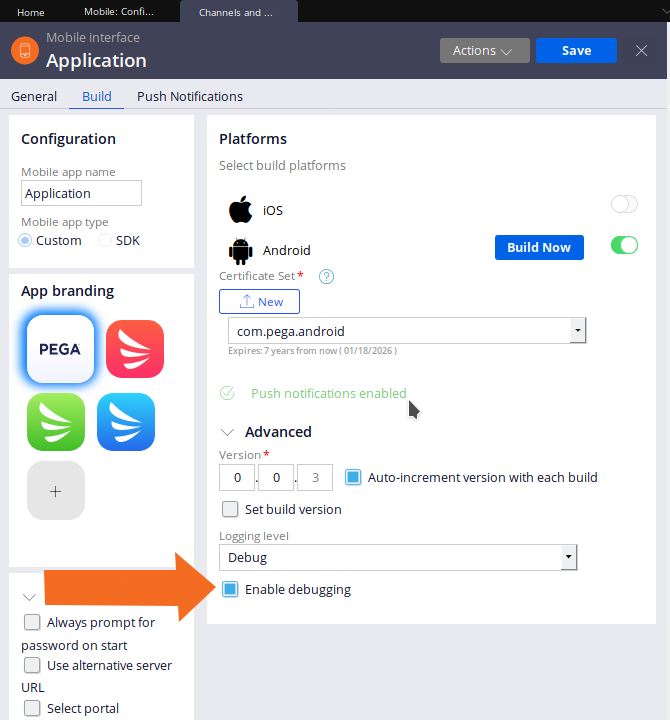
Make sure your application is configured with debugging enabled. In order to check that, go to the Channels and interfaces panel, select your app, modify build, unfold Advanced section. If Enable-debugging was not checked, check it, rebuild the app and reinstall on your mobile device.

-
Preparing computer
-
Chrome browser
Make sure that you have a recent version of Chrome installed on your computer. Newer versions are more likely to work without problems so update to the newest version.
https://www.google.com/chrome/ -
Android platform tools
This package includes adb - a crucial tool to establish connection between device and computer. It can also become handy when debugging connection problems.
https://developer.android.com/studio/releases/platform-tools -
Device drivers
Installing device drivers is only needed if you are running Microsoft Windows.
Google provides a list of links to driver repositories by manufacturer: https://developer.android.com/studio/run/win-usb
If your device came with an installation CD/DVD you may also use that.
-
-
Preparing mobile device
-
Enabling developer options
-
Go to Settings > About phone (or About device)
-
If that is not available go to Settings > System > About phone (or About device)
-
Tap build number 7 times.
-
-
Enabling ADB
-
Go to Settings > Developer options
-
If that is not available go to Settings > System > Developer options
-
Turn USB debugging on.
-
-
Authorizing debug connection
-
Watch your device for authorization request and accept it. It may appear when you connect with USB or later in the process.
-
-
-
Connecting
-
Start the application on your mobile device or enter the application URL in mobile browser
-
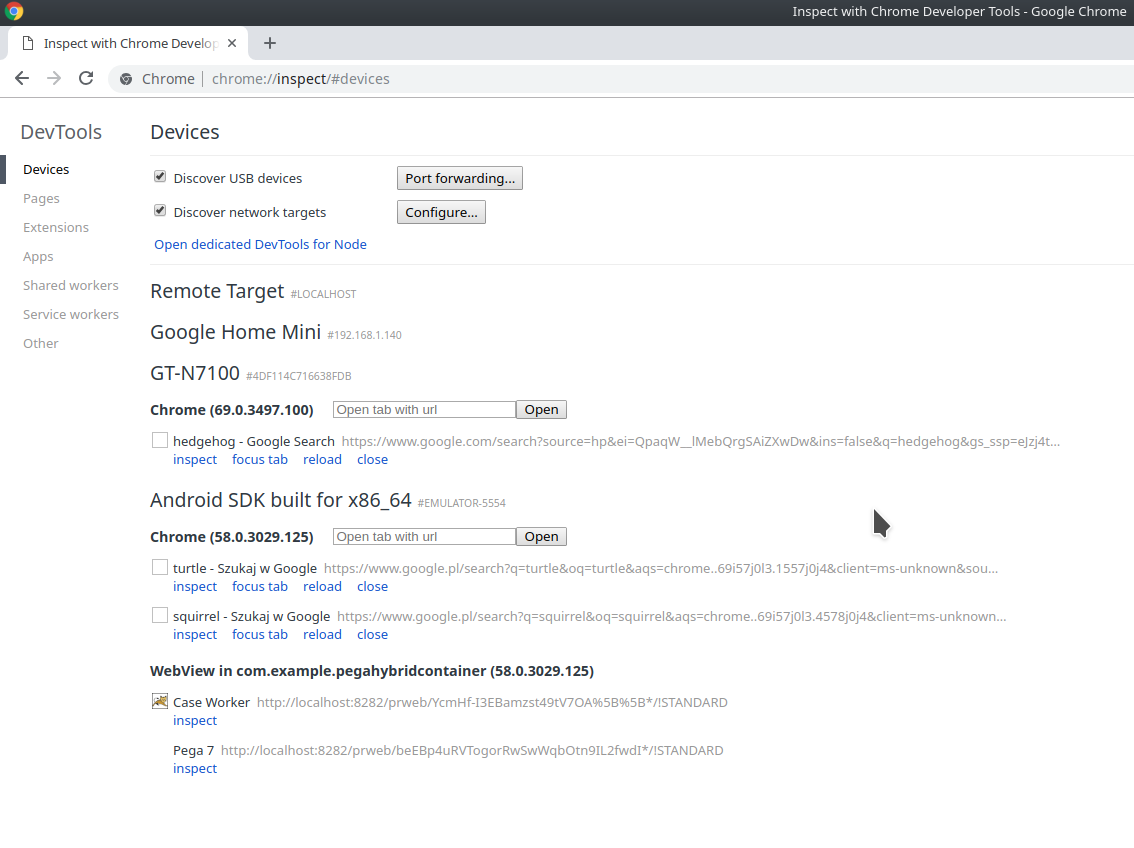
Open Chrome on your computer and go to chrome://inspect
The page contains a list of webviews and browser tabs grouped by device and then by application. In the following example there are 2 connected devices that have some debuggable targets: GT-N7100 and Android SDK build for x86_64.
The first device has one application (Chrome) with one tab to debug. The second device has 2 applications: Chrome and WebView in com.example.pegahybridcontainer which is Pega mobile client. Both applications have two tabs / webviews that we can debug. There is also Google Home Mini which has no open application to debug.

-
Select the right webview.
You should see at least one tab/webview with inspect button. Choose the right one and press inspect to open a Chrome Developer Tools session for it in separate window.-
Mobile browser.
If you intend to debug an application running in mobile browser, once you load the page there should be a tab representing it. -
Mobile Client for Pega version 8.1 and older.
-
There is one webview for WebLogin page. In the example above it is the last one on the list.
-
Once you log-in there will be another webview for the main portal. In the example it is the one but last webview.
-
-
Mobile Client for Pega versions 8.2
Starting with Pega 8.2 there will be different set of webviews:-
only one, portal webview for offline-enabled applications
-
one webview for each open navigation tab in case of online-only applications.
-
-
-
-
Troubleshooting
-
General
-
If your Pega mobile application is running and you see the login screen or you are already logged-in and can see your app on the list in chrome://inspect or it is on the list but there are no webviews with inspect button, then your application is most likely not configured for debugging.
-
If you cannot see your Pega mobile application on the list in chrome://inspect please start a mobile Chrome browser, enter some URL and check if it is listed. If it is, then your app is not configured for debugging.
-
If mobile browser tabs are not listed in chrome://inspect then open terminal (cmd.exe), go to your android platform-tools directory and execute adb devices. There should be (at least) one entry denoted as device.
-
If there are no devices on the list then your device is not connected correctly or you don’t have correct drivers installed.
-
If there is a device on the list but it described as unauthorized then it is an authorization problem.
-
-
If you can run inspector but you are missing some features or some tools are not working, upgrade Chrome on your device or, if you debug in Pega mobile, try another device. The developer tools is a web application served by the device browser. If you run the app in mobile Chrome, DevTools will come from it. If you run in Pega mobile, it will be yet another implementation that comes with Android OS. It may look different, especially on different Android versions, some features may be broken.
-
-
Connection and drivers
-
Make sure your USB cable is OK. Charging may work even with the data lines broken.
-
On Windows, the most common problem is wrong device drivers. Go to device drivers in your computer settings and check for warnings and devices marked as not working properly. Try another drivers. The Google USB driver is reported to actually work for devices other than Google Nexus if installed manually.
-
Check if you have ADB enabled on your mobile device.
-
If you are on linux, missing udev rule will most likely be your problem.
http://www.janosgyerik.com/adding-udev-rules-for-usb-debugging-android-devices/
-
-
Authorization
Usually, the problem with authorization is that you have no chance to authorize your computer because the authorization pop-up is never shown or it was shown in the past, you accepted it but the device forgot your decision and you have no option to accept again. The following is the list of things you can do to provoke authorization request.-
Re-connect your USB cable
-
Re-start adb server: Open terminal (cmd.exe), go to your android platform-tools directory and execute adb kill-server and then adb devices
-
On some (older) Android versions, in developer options there is an option to revoke all ADB authorizations. Use that and re-connect USB cable.
-
On your device, switch USB connection mode from charging to MTP or PTP
-
-
