IE11 performance issues with css selector combination :hover and sibling selectors (+/~)
A lot of developers simply don’t realise, that CSS can be both performant and non-performant.
They manipulate multiple DOM elements , use all CSS3 animations without considering the consequences specially if the page has more DOM elements (1000s ).
Here is an example of a simple CSS combination selector which doesn’t look non performant that has a performance issues in IE11
General Sibling selector with combination of :hover state .For example
a:hover ~p {
 color:red;
}

.testClass button:hover + span{
 background-color:#fff;
}
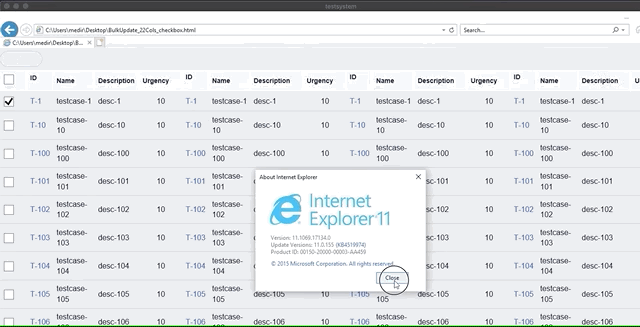
The animated gif shows the problem being discussed , it takes around 5s to select row of a grid which has more than 10000 DOM elements
Technical details
Reflow is a browser process for re-calculating the positions and geometries of elements in the document, for the purpose of re-rendering part or all of the document.
Reflows have a bigger impact on performance and it’s a browser-blocking process and a single reflow can spin off more reflows. Neither the user or your application can perform other tasks during the time when reflow is being executed. This is one of the reasons you encounter issues such as jerky scrolling and unresponsive interfaces.
DOM reflow happens more often that you would expect. It happens when
- Inserting/removing/updating an element in the DOM
- Animating a DOM element
- Using offsetHeight or getComputedStyle
- Changing a CSS style
- Setting a property of the style attribute or changing class of an element
- Activation of CSS-pseudo classes, such as :hover
Only way to avoid this performance issue is to make sure this combination of css selector is not needed for IE11 browser.
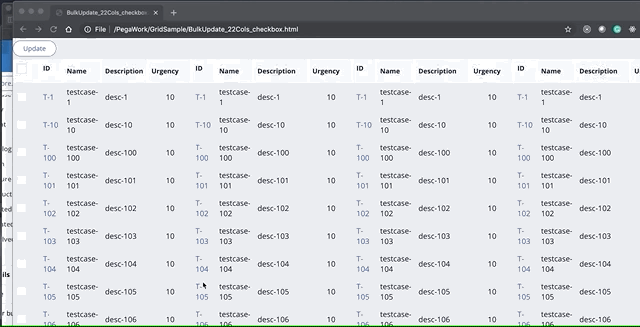
After removing the selectors below is the gif that clearly shows the difference
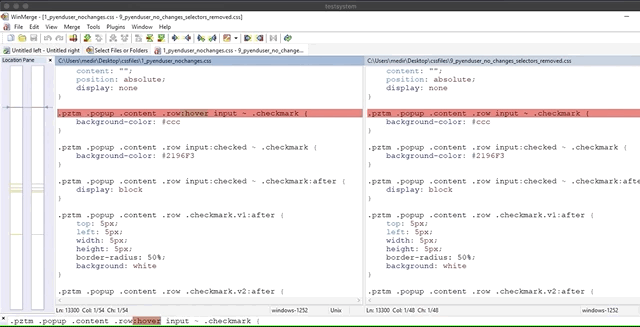
Here are the selectors removed , if you observed having such selectors in stylesheet causes performance issues irrespective of whether they get applied or not. None of the selectors shown in this image are used for the use case
You can use below attached zip file , to see the issue for yourself.
Using browser developer tools to see the repaint times
Reference links of using browser dev tools